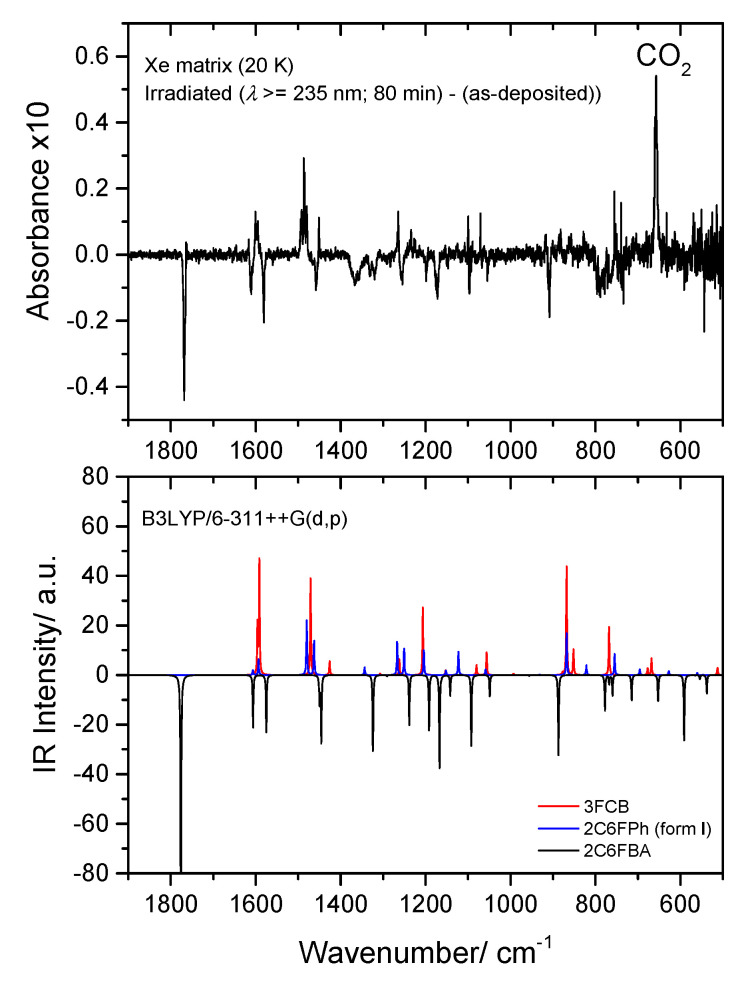
Figure 16.
Top: Low frequency region of the difference IR spectrum: irradiated Xe matrix of 2-chloro-6-fluorobenzoic acid (2C6FBA) minus as-deposited matrix. Bottom: Simulated difference spectrum based on the B3LYP/6-311++G(d,p) calculated IR spectra of 2C6FBA (cis conformer; bands pointing down) and the observed photoproducts: CO2, 2-chloro-6-fluorophenol (2C6FPh) and 3-fluoro-chlorobenzene (3FCB) (bands pointing up). The calculated wavenumbers were scaled by 0.978, and the calculated intensities of the reactant and of the different photoproducts were multiplied by arbitrary factors in order to fit better the observed spectrum (in a ratio of ~3:2:1, 2C6FBA:3FCB:2C6FPh).

