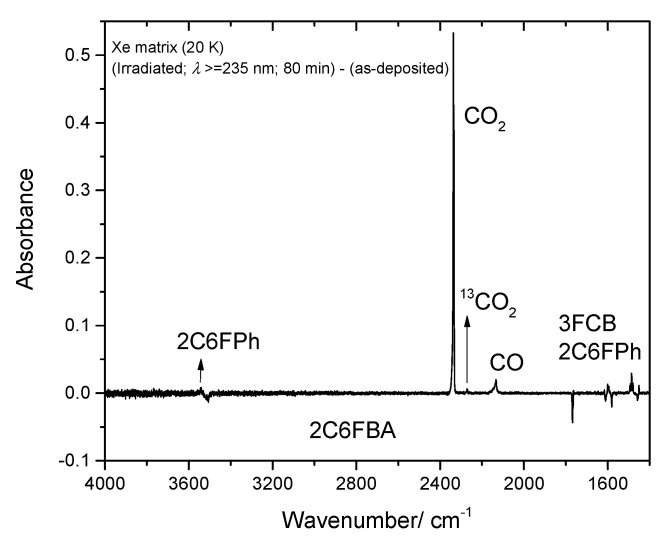
Figure 17.
High frequency region of the difference IR spectrum: irradiated Xe matrix of 2-chloro-6-fluorobenzoic acid (2C6FBA) minus as-deposited matrix. Bands that arise due to the photoproduced CO2 (including its 13C isotopologue), CO, 2-chloro-6-fluorophenol (2C6FPh) and 3-fluoro-chlorobenzene (3FCB) are pointing up, while bands due to the reactant (cis conformer) are pointing down. The lower frequency region shown in this figure (<2000 cm−1) was included to allow a faster comparison of the intensities of the bands with those presented in Figure 16.

