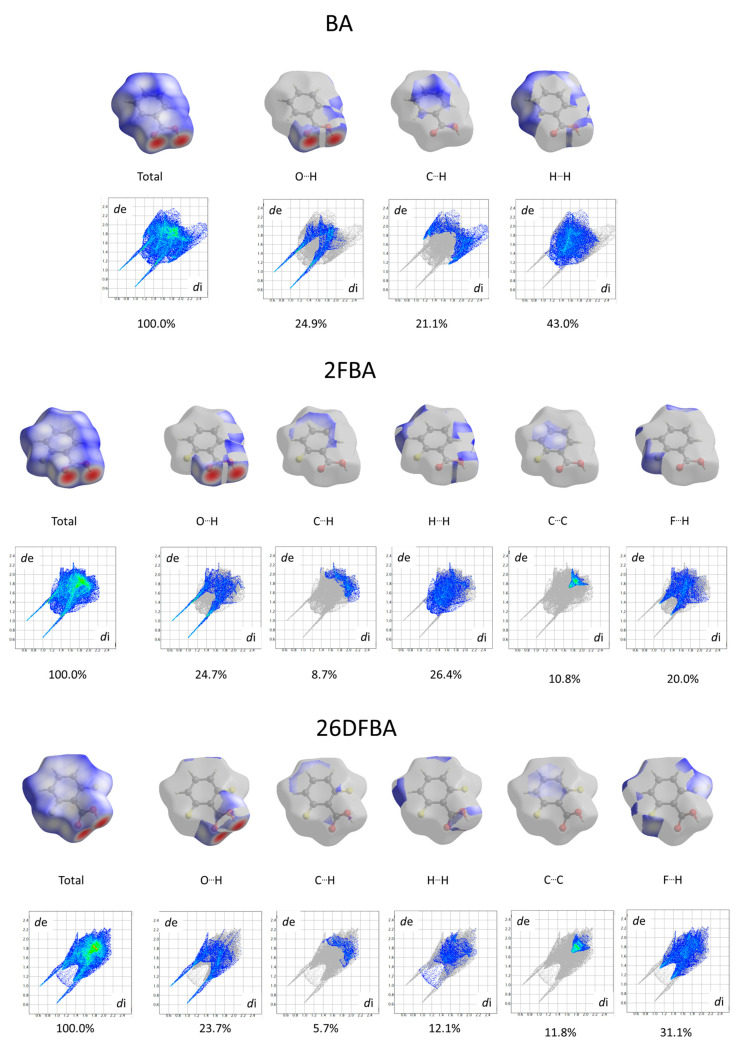
Figure 21.
Total and atom…atom dnorm Hirshfeld plots and 2D-fingerprint plots (de, di) for BA, 2FBA and 26DFBA. Grey, colors means no interaction, blue-to-red colors mean increasing strength of interaction (in the dnorm Hirshfeld plots) or increased number of interactions (in the 2D fingerprint plots).

