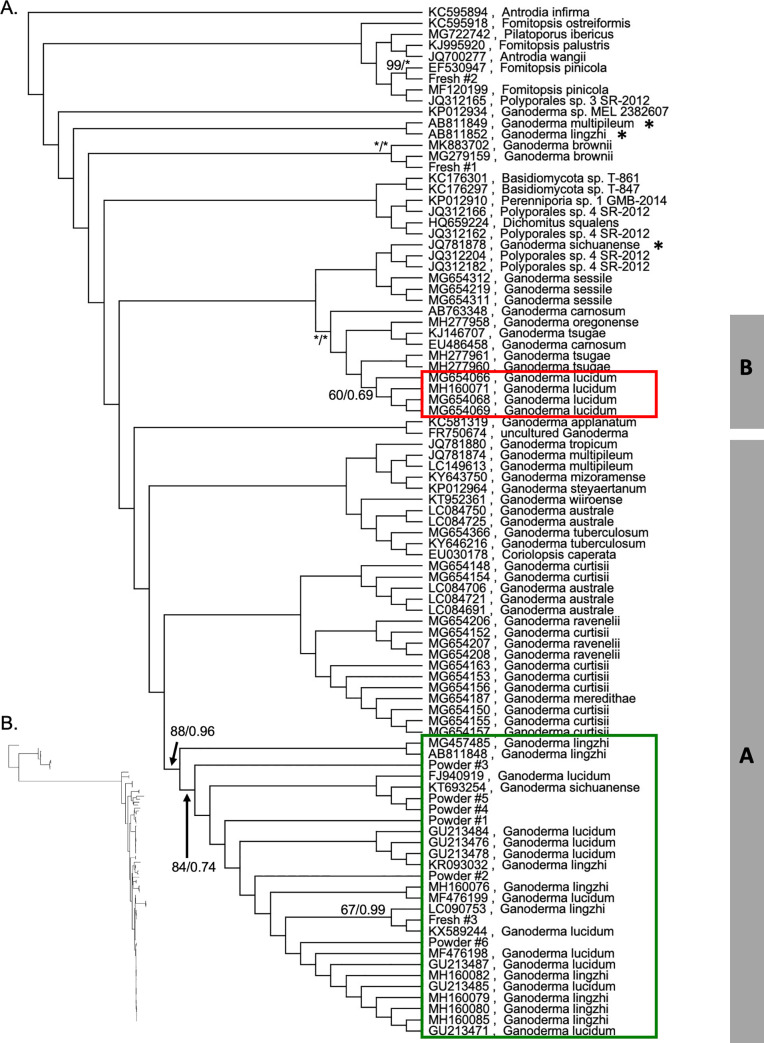
Fig 1. Maximum likelihood phylogenetic analysis.
RAxML phylogeny including store-bought samples, wild collected samples and the Genbank reference set. (A) Cladogram with branch support at critical nodes indicated along the branches as maximum likelihood bootstrap percentage/Bayesian posterior probability (asterisks indicate 100% bootstrap and 1.0 posterior probability). Clade names A and B are from Loyd et al. [22] and Zhou et al. [24]. The red rectangle identifies the true G. lucidum samples per Loyd et al. [14] and the green rectangle contains the samples referred to as the G. lingzhi clade (many G. lucidum sequences are misidentified G. lingzhi). (B) Maximum likelihood phylogram with unlabeled tips in the same order depicting branchlengths proportional to substitutions per site.

