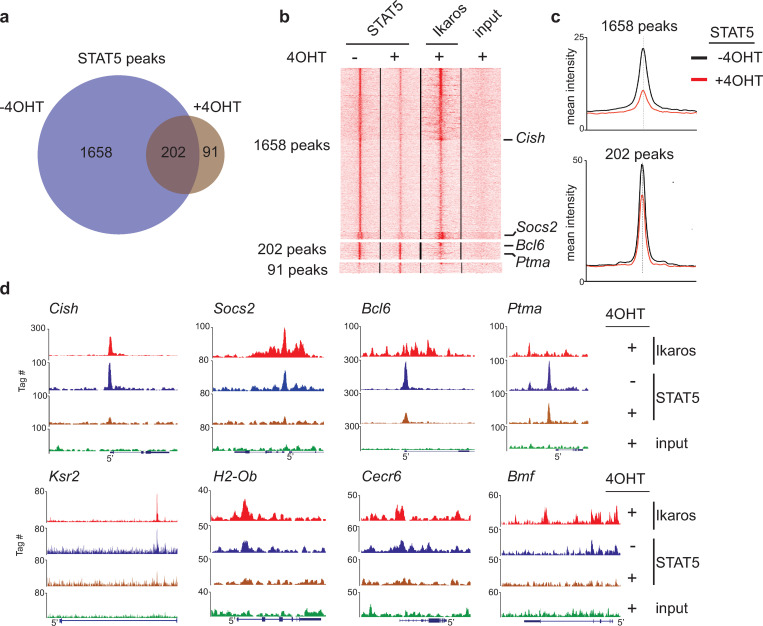
Fig 2. Loss of STAT5 binding upon Ikaros expression at common target genes.
(a) Venn diagram depicting the size and overlap of the STAT5 bound regions in BH1-IK1ER cells cultured in the absence and presence of 4OHT. (b) K-means clustering of the tag densities around the summits of the STAT5 peaks identified in the absence or presence of 4OHT [groups of sites defined in panel (a)]. The position of the peaks illustrated in Fig 2C is indicated. (c) Mean intensity profiles for STAT5 for the sets of 1658 and 202 peaks depicted in panels (a) and (b). (d) Representative genome browser tracks for 7 genes where STAT5 binding is strongly reduced by Ikaros (Cish, Socs2, Bcl6, Ksr2, H2-Ob, Cecr6 and Bmf), and one gene (Ptma) for which STAT5 binding was not affected.

