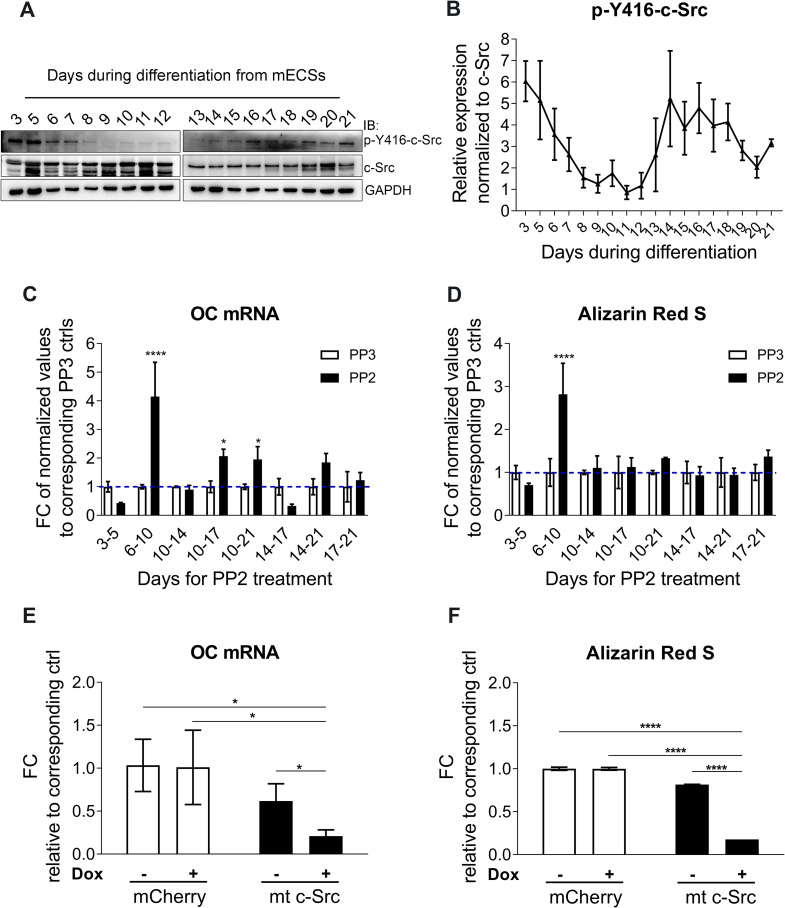
Fig 1. c-Src inhibition enhances osteogenic differentiation in mESCs.
(A) c-Src activity during 21 days of osteogenic differentiation in mESCs. p-Y416-c-Src level and total level of c-Src are analyzed by immunoblotting. GAPDH served as loading control. (B) p-Y416-c-Src band densities are quantified using ImageJ. Normalized values to corresponding total c-Src and GAPDH controls are graphed. (C) Total RNA of day 21 osteo-nodules is subjected to qPCR analysis using OC primer pairs. Fold change in OC expression is calculated by normalizing PP2 treated values to their corresponding PP3 control. Values representing the mean (±SD) of triplicates are graphed and subjected to one-way ANOVA; F (15,32) = 15.85, p<0.0001. Bonferroni's multiple comparisons test indicated significant differences between PP2 and PP3 treated cells for day 6–10 (p<0.0001), day 10–17 (p = 0.0161), and day 10–21 (p = 0.0422). (D) Day 21 osteo-nodules were stained by ARS method. Absorbed stains were extracted and their concentration were quantified and normalized to their corresponding PP3 controls. Data shown represent the mean (±SD) of triplicates and subjected to one-way ANOVA; F (15,32) = 8.651, p<0.0001. Bonferroni's multiple comparisons test revealed significant differences between PP2 and PP3 treated cells for day 6–10 with p<0.0001. (E) Day 14 qPCR analysis for OC mRNA expression in MC3T3-E1s upon overexpression of mt c-Src. Values from doxycycline- free condition were used to normalize the induced condition. Data representing mean of triplicate values (±SD) are graphed. (F) Day 14 differentiated MC3T3-E1 cells for the indicated conditions were subjected to ARS for mineralization assessment and concentrations of extracted Alizarin Red S were quantified. Mean of triplicates (±SD) are graphed and subjected to one-way ANOVA; F (3,8) = 3066, p<0.0001. Bonferroni post hoc analysis was ****p<0.0001 for the indicated comparisons.

