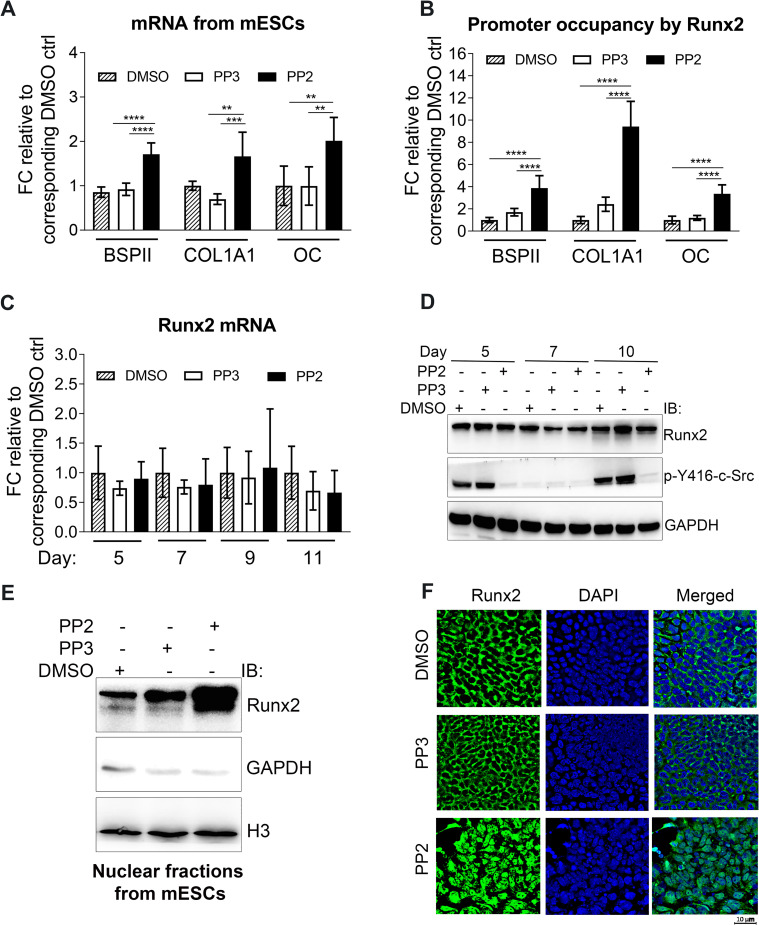
Fig 2. Runx2 nuclear localization and transcriptional activity are increased when c-Src is inhibited in mESCs.
(A) Real-time analysis of Runx2 target genes expression including BSPII, COL1A1, and OC in response to c-Src pharmacological inhibition. Day 10 differentiating EBs were treated with either PP2 (10 μM) or PP3 (10 μM) and DMSO as controls for 24 hrs. Data are expressed as means (±SD) of triplicates. One-way ANOVA is conducted; BSPII: F (2,15) = 42.41, p<0.0001, COL1A1: F (2,15) = 13.52, p = 0.0004, and OC: F (2,14) = 8.428, p = 0.004. Bonferroni's multiple comparisons test results for PP2 vs. DMSO and PP2 vs. PP3 treated results are as follows; BSPII: p<0.0001 for both, COL1A1: p = 0.0098 and p = 0.0004, and OC: p = 0.0087 and p = 0.0084. (B) Promoter occupancy of Runx2 target genes were assessed by ChIP analysis in mESCs. Day 10 differentiating EBs were treated with either PP2 (10 μM) or PP3 (10 μM) and DMSO as controls for 24 hrs. Values were normalized to their corresponding 1% inputs and then normalized to their corresponding DMSO controls. Data shown represent the means (±SD) of triplicates. One-way ANOVA is conducted; BSPII: F (2,24) = 42.95, p<0.0001, COL1A1: F (2,24) = 28.18, p<0.0001, and OC: F (2,24) = 56.17, p<0.0001. Bonferroni's multiple comparisons test results for PP2 vs. DMSO and PP2 vs. PP3 treated results are as follows; BSPII: p<0.0001 for both, COL1A1: p<0.0001 for both, and OC: p<0.0001 for both. (C) Real-time qPCR analysis of Runx2 expression upon c-Src inhibition in mESCs during osteogenic differentiation at day 5, 7, 9, and 11. Data shown represent the means (±SD) of triplicates of three independent experiments. mRNA of each day was normalized to the corresponding DMSO. (D) Protein level of Runx2 with or without c-Src inhibition. Differentiating EBs were treated with DMSO, PP3, or PP2 (10 μM) at different days including day 5, 7, and 9 of osteogenic differentiation and Runx2 protein levels were analyzed by immunoblot. GAPDH served as loading control. (E) Runx2 nuclear fractions in mESCs at day 10 of osteogenic differentiation when c-Src is inhibited. Day 10 differentiating EBs were treated with either PP2 (10 μM) or PP3 (10 μM) and DMSO as controls for 2 hrs. Cell lysates were subjected to immunoblot analysis with GAPDH (cytosolic marker) and H3 (nuclear marker) as loading controls. (F) Runx2 subcellular localization at day 10 of osteogenic differentiation. Day 10 differentiating EBs were treated with either PP2 (10 μM) or PP3 (10 μM) and DMSO as controls for 2 hrs. Cells were then fixed and subjected to immunofluorescence staining using Runx2 antibody (Green). DAPI was used to stain nuclei (blue). *p< 0.05, **p<0.01, ***p<0.005, and ****p<0.0001.

