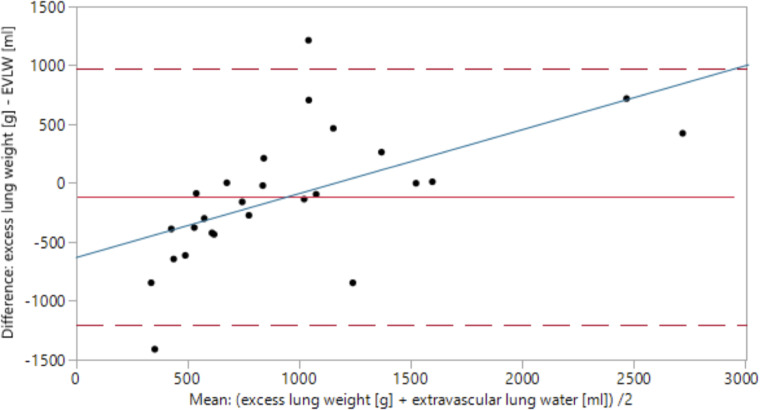
Fig 2. Bland-Altman analysis: Excess lung weight–extravascular lung water.
The x-axis represents the average of associated values of excess lung weight (ELW) and extravascular lung water (EVLW); (ELW + EVLW)/2. The y-axis represents the difference (ELW—EVLW). The mean difference between ELW and EVLW equals -116.6 g (red line). The dashed red lines mark the 95%-confidence interval. y = 0 represents the borderline between overestimation (y>0) and underestimation (y<0) of EVLW by ELW. Over- and underestimation are dependent on the range of measurement (p = 0.002), a trend visualised by the blue regression line.

