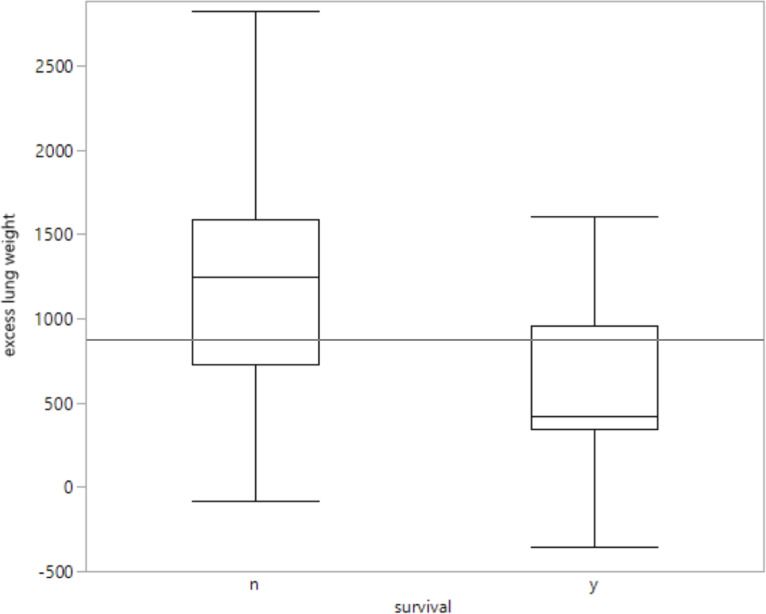
Fig 3. Comparison between excess lung weight and patient survival.
n = no survival, i.e. death during hospitalisation (n = 13); y = yes, i.e. survival during ICU and the subsequent hospitalisation phase (n = 15). The grey line (y = 899.3 g) indicates the mean value of excess lung weight over the total study population.

