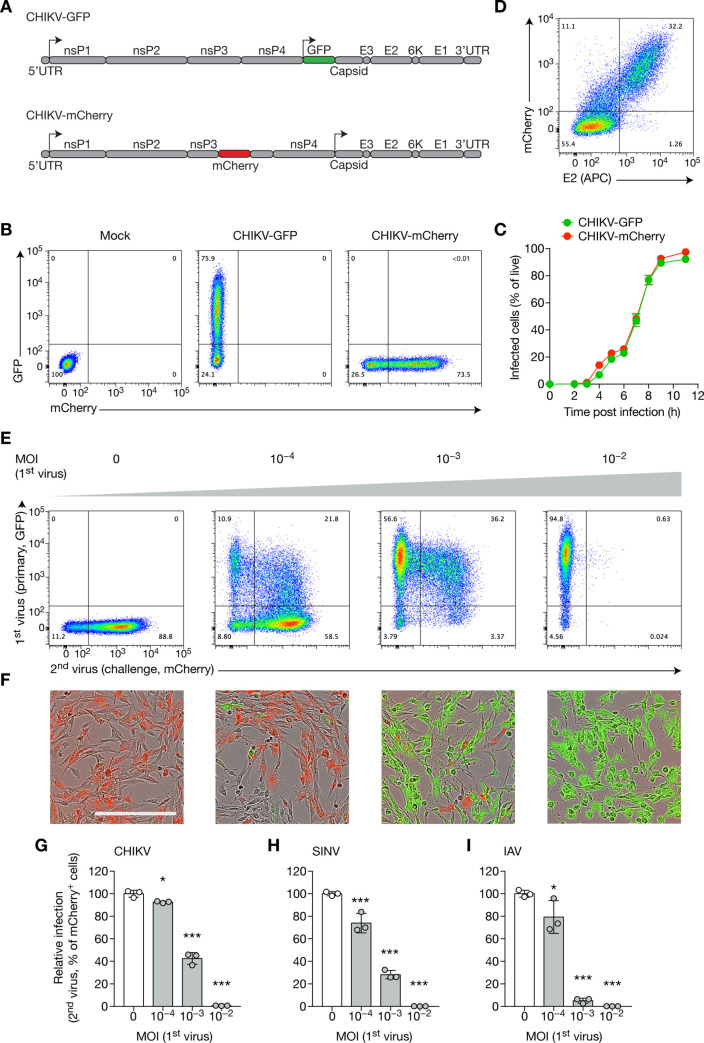
Fig 1. CHIKV superinfection exclusion is not restricted to alphaviruses.
(A) Schematic of CHIKV genome showing non-structural proteins (nsP1–4), structural proteins (E1–3, capsid, 6K) and 5’ and 3’ UTR (untranslated regions). The 5’ genomic, and downstream subgenomic, promoters are indicated by arrows. Reporter viruses generated from the Indian Ocean lineage include: one with a GFP sequence flanked after the subgenomic promoter (CHIKV-GFP); and a strain encoding a fused nsP3-mCherry protein. (B, C) BHK cells were infected with CHIKV-GFP or CHIKV-mCherry at an MOI of 1, and GFP and mCherry levels were measured by flow cytometry. Representative flow cytometry plots (B) and percentage of infected cells over time (C) are shown. (D) BHK cells were infected with CHIKV-mCherry at an MOI of 10−4 for 24 h, then harvested and stained for E2. (E–G) BHK cells were infected with CHIKV-GFP at the indicated MOI for 16 h, then with CHIKV-mCherry at an MOI of 1 for 8 h, then harvested for flow cytometry analysis (E, quantified in G) or followed by intra incubator microscopy (F). Percentage of infection (G) was normalized by naive control mean. Scale, 300 μm. (H, I) BHK cells were infected with CHIKV-mCherry for 16 h at the indicated MOI, then infected with SINV-GFP at an MOI of 1 (H) or with IAV at an MOI of 3 (I) for 8 h. Cells were harvested and analyzed directly by flow cytometry (H) or were intracellularly stained with anti-NP-FITC (I) antibody before analysis. Bars indicate mean ± SD of biological triplicates, and data are representative of at least two independent experiments. NS, not significant; *p < 0.05, ***p < 0.001 (one-way analysis of variance followed by Dunnett’s post-test).

