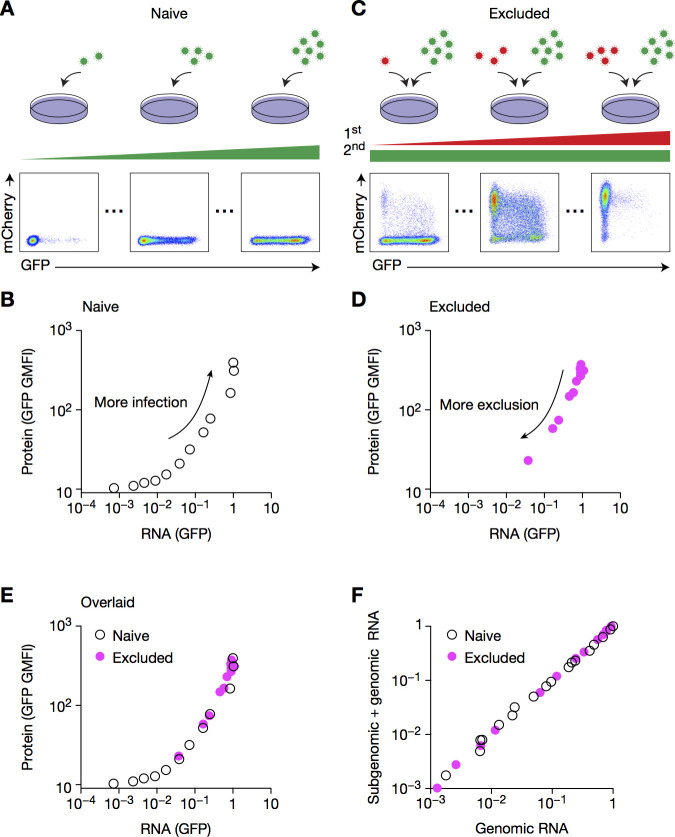
Fig 8. Viral structural protein translation is not impacted in excluded cells.
(A, B) BHK cells were infected with CHIKV-GFP at increasing MOIs for 8 h, then harvested for both flow cytometry and RT–qPCR. Representative flow cytometry plots (A), and quantification of mCherry geometric mean fluorescence intensity (GMFI) and mCherry RNA (B) are shown. (C, D) BHK cells pre-infected with CHIKV-mCherry at increasing MOIs for 16 h then CHIKV-GFP at MOI 1 for 8 h were harvested and depicted as in A and B. (E) Overlaying of B and D. (F) BHKs were infected as in E, and were harvested and analyzed by RT–qPCR with primer–probe sets specific for GFP or for the genomic form of CHIKV-GFP (referred to as GFP-genomic), whose respective sensitivity and specificity were tested in S3 Fig. Data are representative of two independent experiments.

