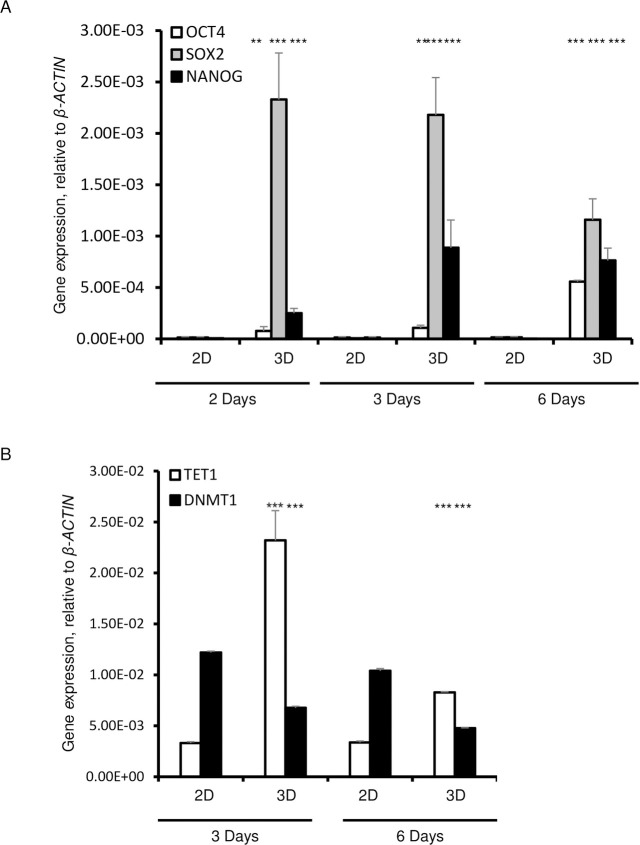
Fig 2. Expression of pluripotency markers, OCT4, SOX2, and NANOG in 3D spheroids cultured for 2, 3, and 6 days.
A. qPCR of OCT4, SOX2 and NANOG. B. q PCR analysis of TET1 and DNMT1. Data are presented as the means ± SD from 3–6 independent experiments. β-ACTIN was used as a housekeeping control. Statistical significance is shown as * (p≤0.05), ** (p ≤0.005), and *** (p ≤0.0005) in 3D as compared to 2D cultured cells.

