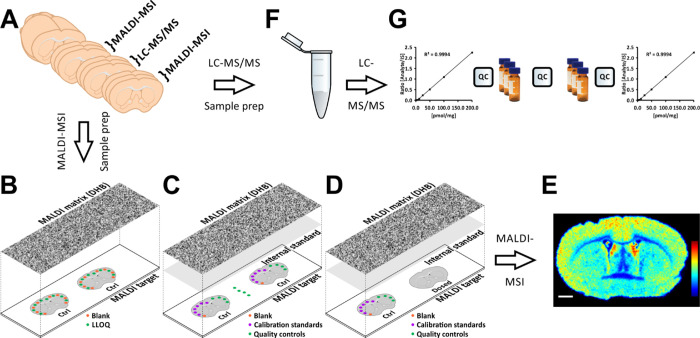
Figure 1.
Validation, quantitation, and cross-validation of the MALDI-MSI methodology for quantitative analysis of distributions of the model substance citalopram. (A) Tissue sections were cut using a cryomicrotome at 14 μm thickness, and consecutive sections were collected for the different platforms. Sections collected for MALDI–MSI were thaw-mounted onto ITO-coated glass slides, while sections for LC–MS/MS were collected in microcentrifuge tubes. (B) Selectivity values were determined by measuring signal ratios between the lower limit of quantitation (LLOQ) and blank samples, deposited in 50 nL spots on control tissue and then coated with a uniform layer of MALDI matrix (2,5-dihydroxybenzoic acid, DHB) using an automated sprayer. (C) Accuracy, precision, and recovery values were obtained from measurements of 50 nL blank, calibration standard, and QC spots deposited on control tissue. QC samples were also spotted directly onto glass slides to measure recoveries of the analyte and internal standard (IS). For this, the MALDI target was coated with a uniform layer of IS followed by the MALDI matrix. (D) Arrangement of dosed and spotted control tissue for quantitation. Blank, calibration standard, and QC samples (50 nL) were deposited and subsequently coated with uniform layers of the IS and MALDI matrix. (E) Resulting ion intensity distributions of citalopram, normalized with respect to the IS, are presented using a rainbow scale. The scale bar is 1 mm. (F) Tissue cleanup protocol for LC–MS/MS. The tissue sections were homogenized, and the IS was added prior to liquid–liquid extraction and sample filtration. The sample was then evaporated and reconstituted before further analysis. (G) LC–MS/MS validation and quantitation were performed in a block design with every sample analyzed in triplicate, with QC samples between every block and standards for generating calibration curves at the start and end of the sequence.

