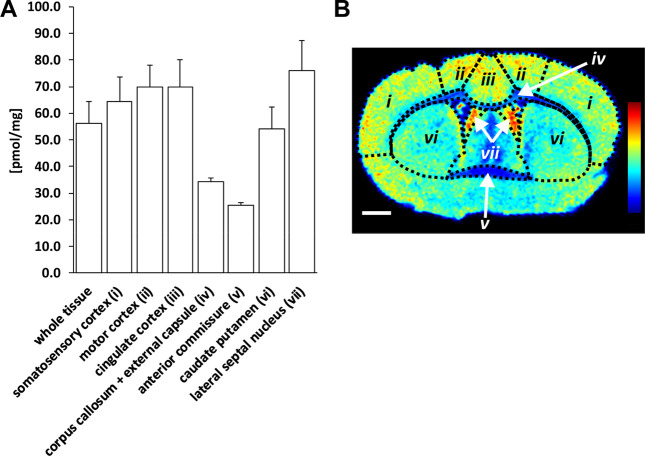
Figure 2.
Quantitation of citalopram in selected brain regions. (A) Bar chart showing average citalopram concentrations detected in coronal brain tissue sections (n = 3) of one dosed animal (designated D5). Concentrations in pmol/mg (mean ± SD) in whole tissue sections, (i) somatosensory cortex, (ii) motor cortex, (iii) cingulate cortex, (iv) corpus callosum and external capsule, (v) anterior commissure, (vi) caudate putamen, and (vii) lateral septal nucleus were 56.1 ± 8.3, 64.3 ± 9.3, 70.0 ± 8.0, 69.8 ± 10.3, 34.2 ± 1.6, 25.3 ± 1.0, 54.2 ± 8.3, and 76.2 ± 11.0, respectively. (B) Ion image of coronal brain tissue section showing the seven brain regions of interest, with heat map displaying citalopram distribution in ion intensities from lowest (blue) to highest (red), normalized with respect to the internal standard. Scale bar is 1 mm and coronal level is 0.20 mm (distance from bregma).

