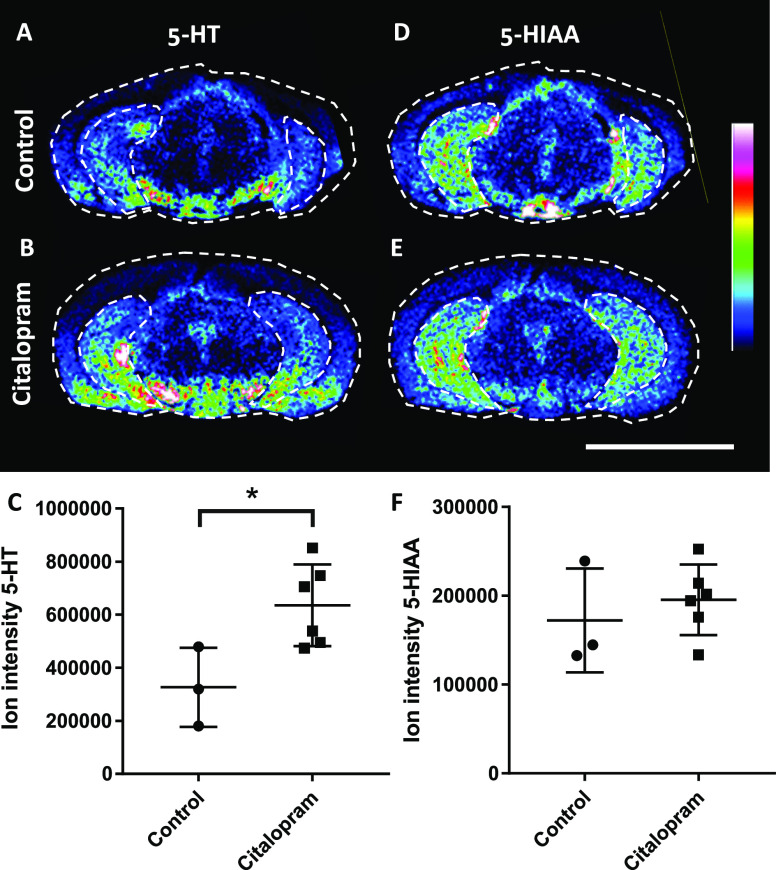
Figure 3.
Ion images of 5-HT and 5-HIAA in coronal brain tissue sections and quantitation in the hippocampus from citalopram administered animals and controls. Ion distribution images of 5-HT (m/z 444.21) in the (A) control and (B) citalopram-dosed tissue samples. The range of the color ion intensity scale is 0–50%. (C) Relative intensities of 5-HT in the hippocampus of controls (n = 3) and citalopram administered animals (n = 6). Ion distribution image of 5-HIAA (m/z 459.17) in (D) control tissue and (E) citalopram-dosed tissue. The range of the color ion intensity scale is 0–40%. (F) Relative intensities of 5-HIAA in the hippocampus of controls (n = 3) and citalopram-administered animals (n = 6). Data were normalized by the root-mean-square of all data points. Scale bar is 5 mm and coronal level is −5.6 mm (distance from bregma). *p < 0.05.

