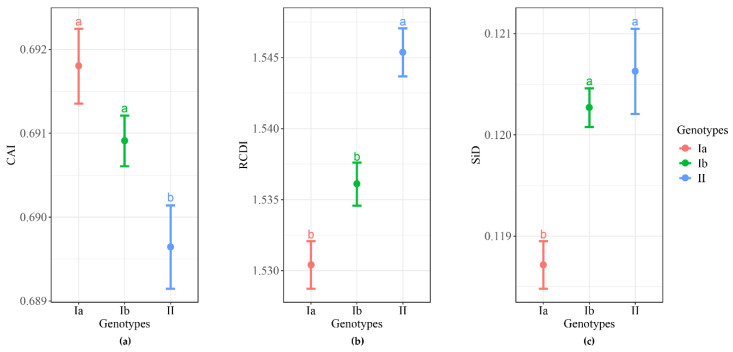
Figure 7.
Analysis of TGEV adaptation to pig. (a) Codon adaptation index (CAI) of the TGEV complete CDS to pig. (b) Codon deoptimization index (RCDI) of the TGEV complete CDS to pig. (c) Similarity index (SiD) of the TGEV complete CDS to pig. Different lowercase letters indicate significant difference at the 5% level. Genotypes Ia, Ib, and II are represented in orange, green, and blue, respectively.

