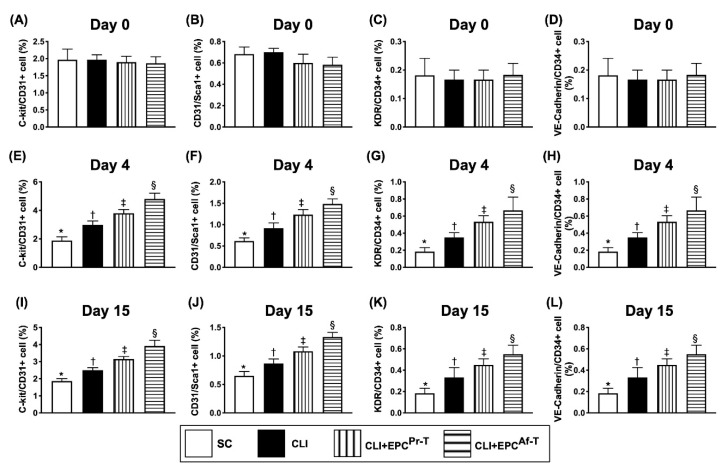
Figure 9.
Illustrating the time courses of flow cytometric analysis of circulating levels of EPCs. (A–D) By day 0, the analytical of numbers of circulating levels of c-kit/CD31+ (A), CD31/sca-1+ (B), KDR/CD34+ (C) and VE-Cadherin/CD34+ (D) cells, all p value > 0.5; (E–H) By day 4, the analytical of numbers of circulating levels of c-kit/CD31+ (E), CD31/sca-1+ (F), KDR/CD34+ (G) and VE-Cadherin/CD34+ (H) cells, all p value < 0.0001; (I–L) By day 15, analytical of numbers of circulating levels of c-kit/CD31+ (I), CD31/sca-1+ (J), KDR/CD34+ (K) and VE-Cadherin/CD34+ (L) cells, all p value < 0.0001. All statistical analyses are performed by one-way ANOVA, followed by the Bonferroni multiple comparison post hoc test (n = 6 for each group). Symbols (*, †, ‡, §) indicate significance (at 0.05 level). SC = sham-operated control; CLI = critical limb ischemia; EPC = endothelial progenitor cells; EPCPr-T = EPCs derived from severe PAOD patient’s circulatory blood prior to CD34+ cell and HBO treatment; EPCAf-T = EPCs derived from severe PAOD patient’s circulatory blood after CD34+ cell and HBO treatment; PAOD = peripheral arterial occlusive disease; HBO = hyperbaric oxygen.

