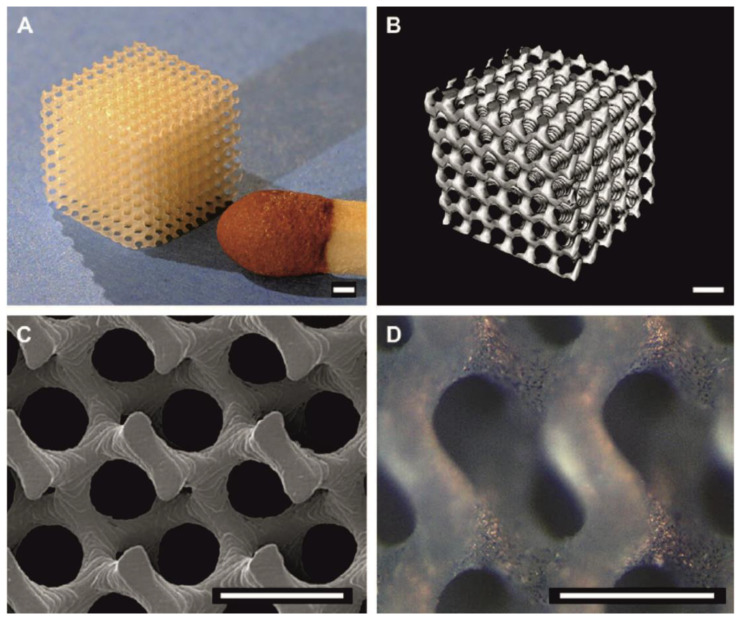
Figure 9.
Images of PDLLA network scaffolds with a gyroid architecture prepared by stereolithography: (A) photograph, (B) microcomputed tomography (µCT) visualization and (C) SEM image. In (D) a light microscopy image is shown for a scaffold seeded with mouse pre-osteoblasts after 1 d of culturing. Scale bars represent 500 µm [57]. (With permission from Elsevier, 2009).

