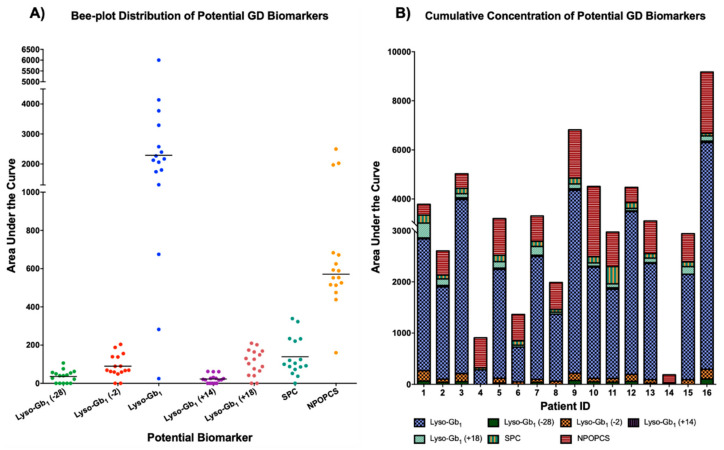
Figure 8.
Bee-plot distribution (A) and cumulative concentrations (B) of potential GD biomarkers highlighted in the current metabolomic study. Sphingosylphosphorylcholine (SPC) and N-palmitoyl-O-phosphocholineserine (NPOPCS). The line in (A) represents the median value for each potential biomarker. All potential GD biomarkers were not observed in healthy controls.

