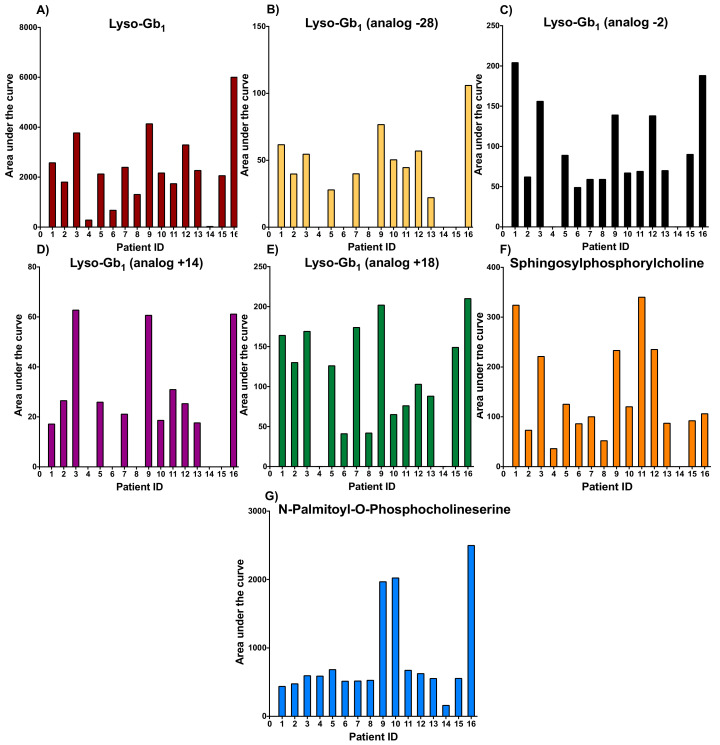
Figure A2.
Areas under the curve are shown for lyso-Gb1 (A), lyso-Gb1 analog +18 Da (B), lyso-Gb1 analog −2 Da (C), lyso-Gb1 analog −28 Da (D), lyso-Gb1 analog +14 Da (E), sphingosylphosphorylcholine (F), and N-palmitoyl-O-phosphocholineserine (G). These biomarkers were not detected in control samples.

