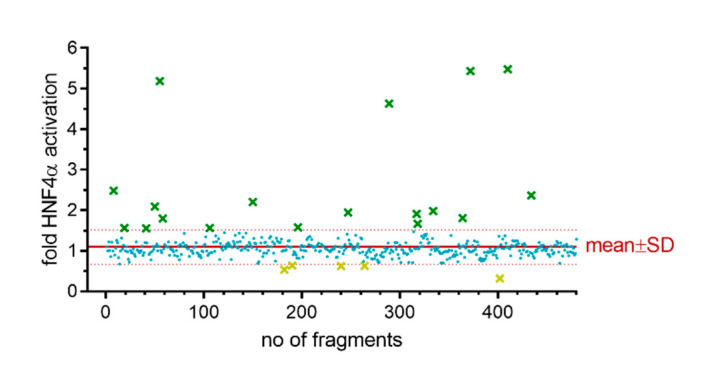
Figure 2.
Activity distribution and primary hits in the fragment screening. Red line shows the mean, dotted red lines show mean ± SD. Each point represents the activity of one fragment at 50 µM expressed as mean fold activation vs. 0.2% DMSO from two biologically independent repeats. Green crosses refer to HNF4α agonist candidates, yellow crosses refer to inverse HNF4α agonist candidates, blue dots represent fragments without activity on Gal4-HNF4α.

