Figure 3.
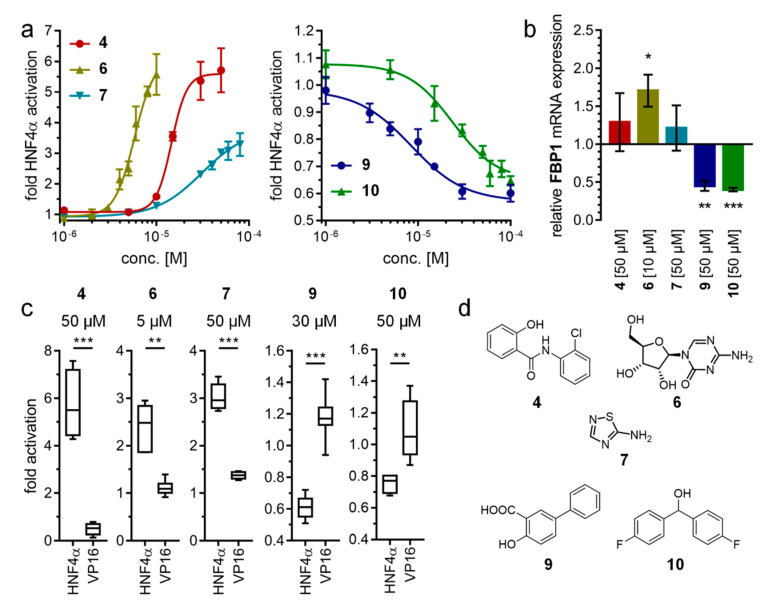
In vitro characterization of HNF4α modulators 4, 6, 7, 9, and 10. (a) Dose–response curves of 4, 6, 7, 9, and 10 on Gal4-HNF4α (mean ± S.E.M.; n ≥ 4). (b) Effects of 4, 6, 7, 9, and 10 on mRNA expression of fructose-1,6-bisphosphatase 1 (FBP1) in human hepatocytes (HepG2). HNF4α activators 4, 6, and 7 promoted FBP1 expression, while the inverse HNF4α agonists 9 and 10 decreased FBP1 mRNA levels. Data are the mean ± S.E.M. mRNA levels determined by qRT-PCR and analyzed by the 2−ΔΔCt method; n = 3. (c) Control experiments on Gal4-VP16 (boxplots show mean, min.-max.; n ≥ 4). (d) Chemical structures of 4, 6, 7, 9, and 10. * p < 0.05, ** p < 0.01, *** p < 0.001 (t-test).

