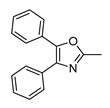
Table 1.
Primary screening hits with primary screening data and control experiment on VP16 for non-specific activity. Primary screening data are the mean of two biologically independent repeats. HNF4α follow-up data and VP16 control data are the mean ± SD fold activation of reporter activity of at least four biologically independent repeats in duplicates. n.s.—not significant (p ≥ 0.05), ** p < 0.01, *** p < 0.001 (t-test).
| ID | Structure | Primary Screen (Fold Act., 50 µM) |
Follow-up HNF4α | VP16 Control | HNF4α vs. VP16 |
|---|---|---|---|---|---|
| 1 |

|
2.48 | 1.1 ± 0.2 (50 µM) |
0.80 ± 0.07 (50 µM) |
n.s. |
| 2 |

|
1.55 | 1.3 ± 0.2 (50 µM) |
1.3 ± 0.3 (50 µM) |
n.s. |
| 3 |

|
2.09 | 1.5 ± 0.2 (50 µM) |
1.7 ± 0.3 (50 µM) |
n.s. |
| 4 |

|
5.18 | 4 ± 2 (50 µM) |
0.5 ± 0.2 (50 µM) |
p = 0.0014 (**) |
| 5 |

|
1.80 | 2.5 ± 0.2 (100 µM) |
1.1 ± 0.1 (100 µM) |
p < 0.0001 (***) |
| 6 |

|
5.48 | 2.4 ± 0.5 (5 µM) |
1.1 ± 0.1 (5 µM) |
p = 0.0034 (**) |
| 7 |

|
2.36 | 3.0 ± 0.3 (50 µM) |
1.4 ± 0.1 (50 µM) |
p < 0.0001 (***) |
| 8 |

|
2.09 | 1.1 ± 0.2 (50 µM) |
0.92 ± 0.07 (50 µM) |
n.s. |
| 9 |

|
0.54 | 0.6 ± 0.1 (30 µM) |
1.2 ± 0.2 (30 µM) |
p < 0.0001 (***) |
| 10 |

|
0.63 | 0.75 ± 0.05 (50 µM) |
1.1 ± 0.2 (50 µM) |
p = 0.0057 (**) |
| 11 |

|
0.32 | 0.21 ± 0.03 (100 µM) |
0.21 ± 0.02 (100 µM) |
n.s. |
