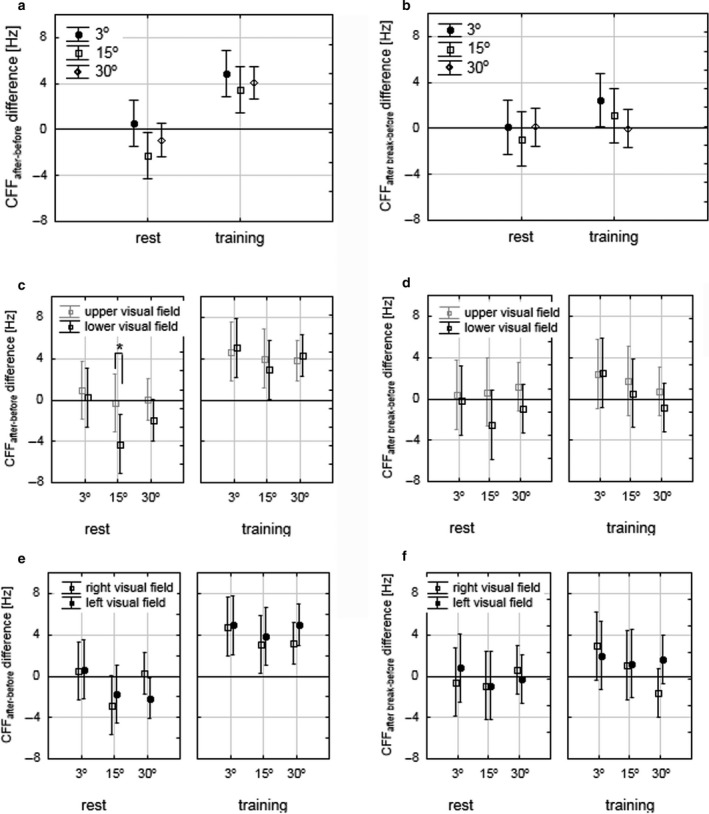
FIGURE 4.

Mean CFFafter‐before differences (a, c, e) and CFFafter break‐before (b, d, f) differences during rest and training, at 3°, 15°, and 30° eccentricities. Comparison between eccentricities: (a) and (b), comparison between vertical VHs: (c) and (d), comparison between horizontal VHs: (e) and (f). *Statistically significant differences, bars – 0.95 confidence level. CFF, critical fusion frequency; VHs, visual hemifields
