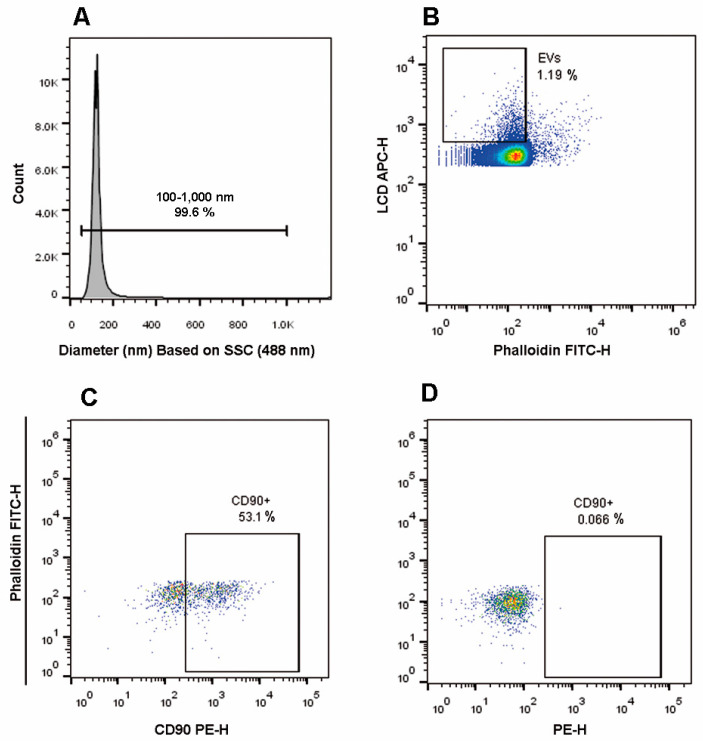
Figure 4.
MSC-derived EV analysis. (A) The size of events was obtained by transforming .fcs files through the Rosetta Calibration system. The size of EVs was represented as a histogram and a gate covering EV dimensions was drawn (100–1000 nm). (B) Events displaying a diameter in the range 100–1000 nm were then analyzed on a Phalloidin FITC-H/LCD-H dot-plot and LCD+/Phalloidin- events were identified as EVs. (C) EVs were analyzed for their positivity to CD90 expression: (D) the dot-plot represents the FMO for CD90. The figure is representative of at least three separate experiments.

