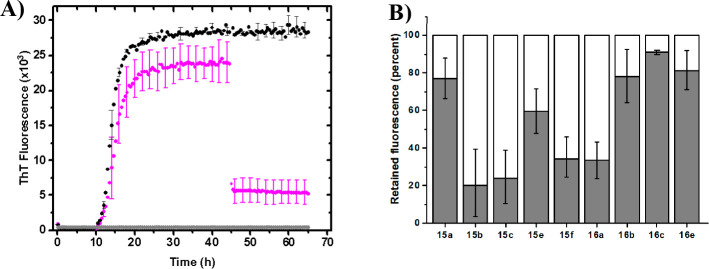
Figure 4.
Retained ThT fluorescence after addition of selected compounds to mature Aβ40 fibrils in vitro. (A) ThT fluorescence trace for addition of compound 15b (magenta), α-Syn control (black), and ThT background fluorescence (gray). (B) Bar chart representation of the retained fluorescence (60 h), compared to the intensity before compound addition (40 h).

