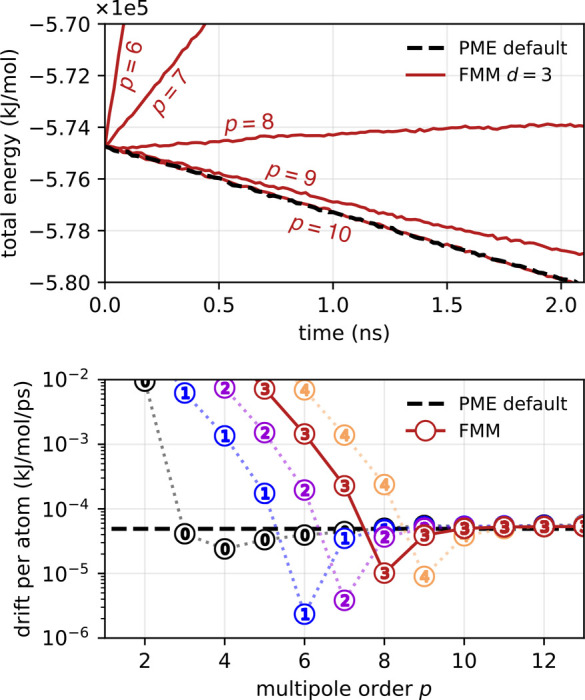
Figure 12.

Drift of total energy at typical mixed-precision settings for the periodic salt water system. Dashed black lines show the total (in this case negative) energy drift with PME (Δt = 4 fs, “default” PME parameters as given in Figure 9, default Verlet buffer tolerance of 0.005 kJ/mol/ps). (top) Evolution of total energy with FMM at depth 3 (red) compared to PME (black). (bottom) Absolute drift of total energy derived from a linear fit. At depth d = 3 (encircled numbers), which results in optimal FMM performance for this system, for p ≥ 8, the positive drift component from the FMM does not lead to an increased total drift.
