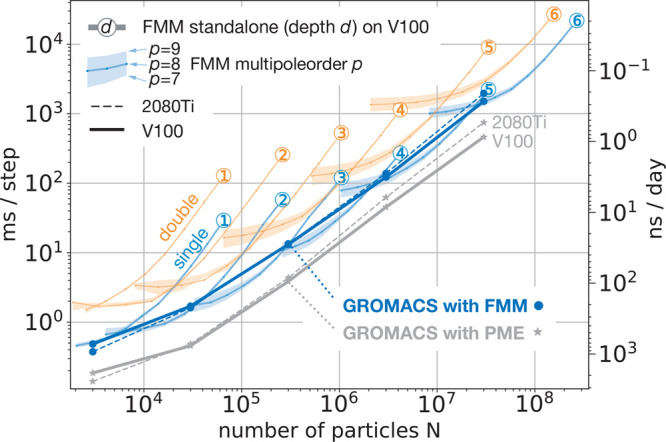
Figure 15.

FMM and PME scaling with respect to system size N for up to 268 million charges. Benchmarks were run on an NVIDIA Tesla V100 GPU with 32 GB RAM (solid lines) and on an RTX 2080Ti GPU (dashed lines). Blue (single precision) and orange (double precision) colors denote FMM standalone timings for the random charge benchmark (left scale) with depths d = 1–6 (encircled numbers) and multipole order p = 8, whereas the lower and upper boundaries of the shaded regions indicate timings for p = 7 and p = 9. Gray and dark blue lines show wall clock time per MD step (left scale) and resulting GROMACS performance (right scale) for PME (gray stars) and FMM (blue circles) for water boxes of different sizes. GROMACS benchmarks were run on a 10-core E5-2630v4 node with RTX 2080Ti GPU (dashed lines) and on a 20-core Xeon Gold 6148F with V100 GPU (solid lines) with all nonbonded interactions offloaded to the GPU.
