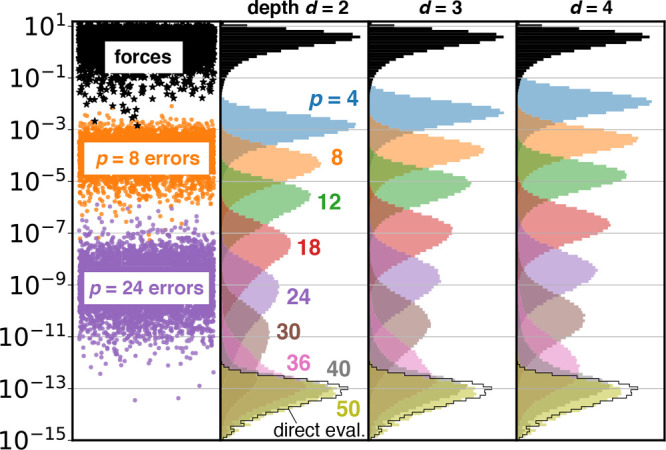
Figure 3.

FMM errors for the 50 675 atom salt water droplet (Figure 1) using double precision. (left) Absolute values of individual force components (black stars, index on x-axis), and deviations from reference values for exemplary cases p = 8 (orange dots) and p = 24 (purple dots). Colored histograms show distributions of absolute errors in the forces for multipole approximations p = 4–50 and tree depths d = 2, 3, and 4. For comparison, black histograms show distributions of actual forces (in absolute values). The black outline near the bottom shows the error for directly evaluating all interactions. Note that the black force histograms were scaled by 0.75 to fit in the panels.
