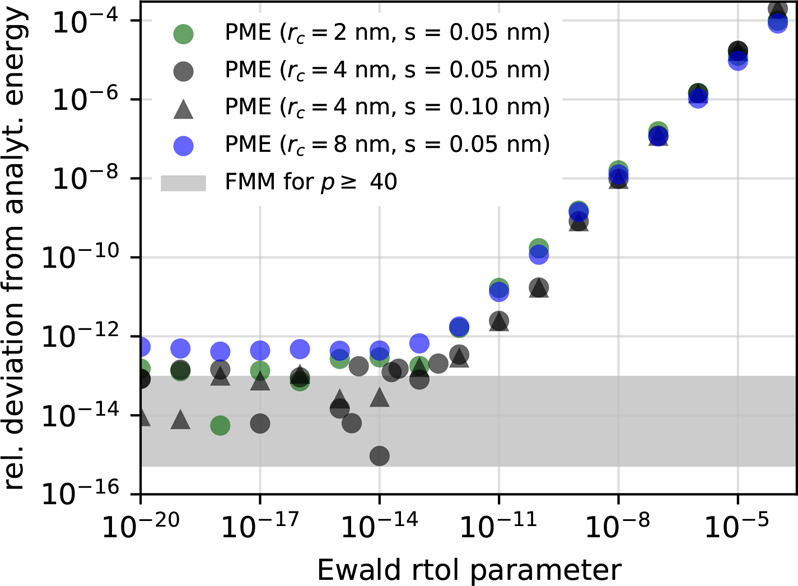
Figure 8.

PME energy error for the ideal crystal (double precision). Circles show the relative deviation of the energy computed with PME from its correct value as a function of the ewald-rtol parameter for interpolation order 12 for four parameter sets (see legend, rc = real-space cutoff, s = PME grid spacing) For comparison, the corresponding FMM errors for p ≥ 40 are indicated by the shaded region (compare Figure 7).
