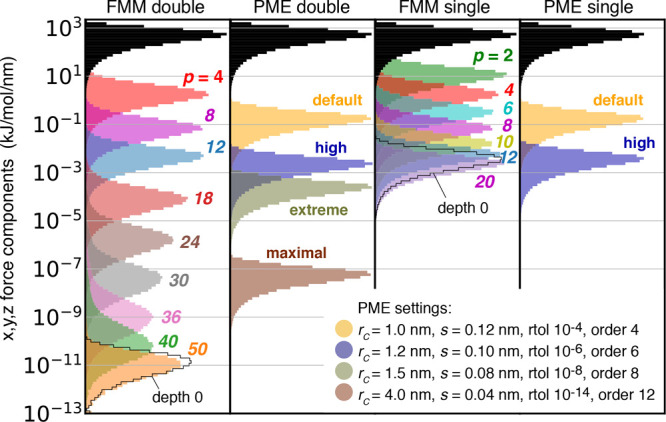
Figure 9.

Accuracy of FMM and PME Coulomb forces for a snapshot of the 50 675 atom periodic salt water system for double precision (left two panels) and single precision (right two panels). Black histograms show distributions of actual forces (in absolute values). For FMM, colored histograms show distributions of absolute errors in forces for multipole approximations p = 2–50 at d = 3. For PME, values for four representative parameter sets are shown color coded (see legend). Note that the black force histograms were multiplied by 0.9 to fit in the panels. The black outline in the FMM panels shows the error for a direct evaluation of all interactions that are in the simulation box (d = 0) combined with a p = 50 (for double precision, p = 20 for single) multipole approximation for the surrounding periodic images.
