
Figure 1. Representative coronary computed tomography angiography image of pericoronary adipose tissue attenuation around the proximal left anterior descending coronary artery.
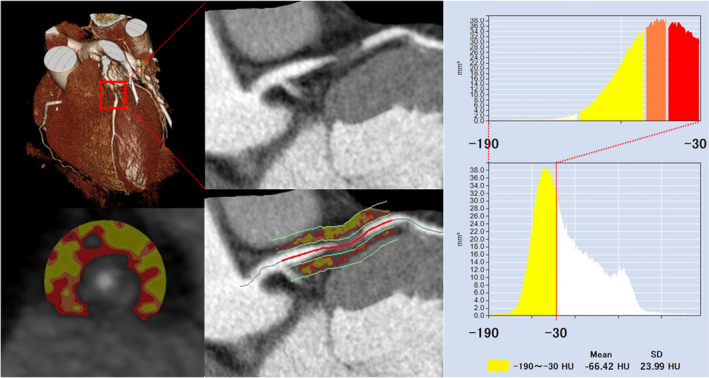
Pericoronary adipose tissue attenuation is defined as the mean computed tomography attenuation value (−190 to −30 HU) within a radial distance equal to the diameter of the vessel. CT indicates computed tomography; and LAD, left anterior descending coronary artery.