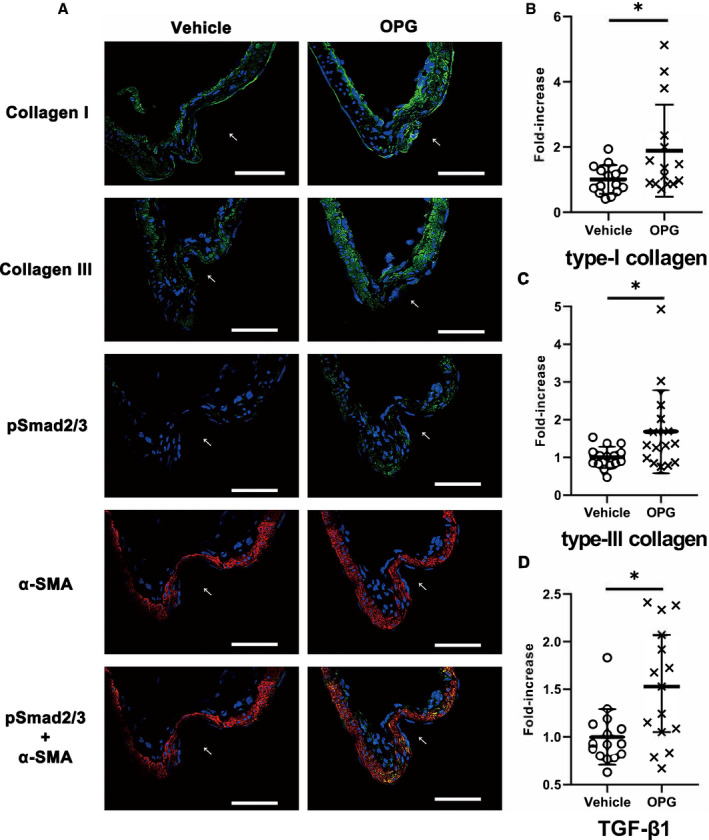
Figure 3. Histological and mRNA expression analyses of intracranial aneurysms demonstrating that osteoprotegerin promoted collagen expression and transforming growth factor‐β1‐Smad2/3 signaling in intracranial aneurysm walls.

A, Immunohistochemical staining of type‐I and type‐III collagen (green), phosphorylated Smad2/3 (green), and α‐smooth muscle actin (red) in intracranial aneurysm walls (left, vehicle treatment; right, osteoprotegerin treatment). All samples were co‐stained with DAPI (blue). The arrows indicate the luminal sides of intracranial aneurysms. Scale bar: 50 μm. Type‐I collagen (B), type‐III collagen (C), and transforming growth factor‐β1 (D) mRNA‐expression levels were evaluated by quantitative reverse transcription‐polymerase chain reaction analysis, and the data were normalized to β‐actin expression. Expression levels are presented as fold‐increases over the expression levels in the vehicle group. The results are presented as the mean±SD (n=15) for each group. pSmad2/3 indicates phosphorylated Smad2/3; TGF‐β1, transforming growth factor‐β1; and α‐SMA, α‐smooth muscle actin. *P<0.05 vs the vehicle group, as determined using the Mann–Whitney U test.
