
Figure 3. Biomarkers of neurologic injury over time.
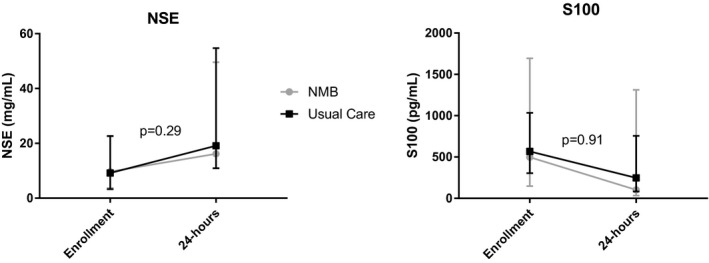
Change in biomarker levels over time assessed via mixed model, controlling for shock stratification as a fixed effect and study site as a random effect. Biomarker values log transformed for the analysis as their distributions visually deviated from normal. P values reflect the interaction between randomization group and time. NMB indicates neuromuscular blockade; and NSE, neuron‐specific enolase.