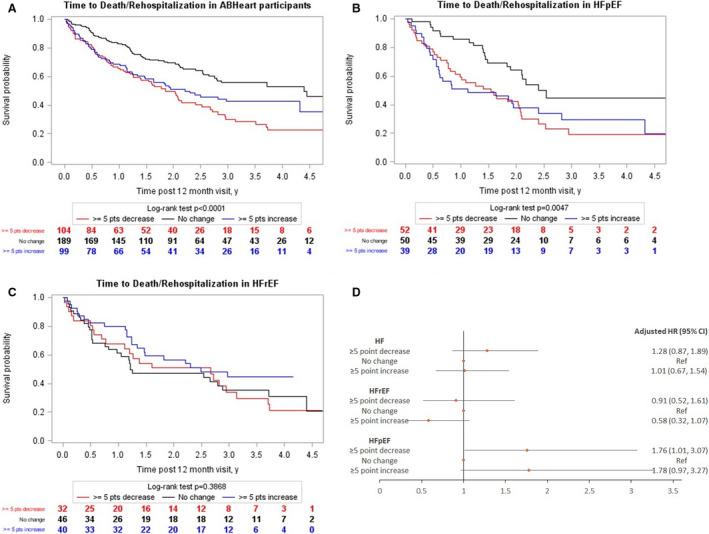
Figure 2. Kaplan–Meier curves for death and rehospitalization after 12‐month assessment for patients with KCCQ overall summary score available at baseline and at 12 months: (A) in total Alberta HEART (Heart Failure Aetiology and Analysis Team) cohort (N=392); (B) in patients with HFpEF (N=141); (C) in patients with HFrEF (N=118); and (D) the adjusted hazard ratios in patients with HF and those with HFrEF and HFpEF.

HF indicates heart failure; HFpEF, heart failure with preserved ejection fraction; HFrEF, heart failure with reduced ejection fraction; HR, hazard ratio; KCCQ, Kansas City Cardiomyopathy Questionnaire; and Ref, reference.
