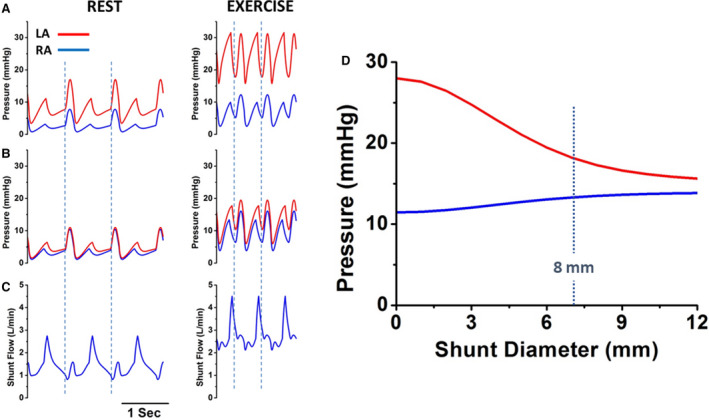
Figure 3. Hemodynamic effects of interatrial shunt device (IASD) based on cardiovascular simulation models.

A, Mean right (blue) and left (red) atrial pressures as a function of shunt diameter based on hemodynamics of an average patient with heart failure with preserved ejection fraction (HFpEF). B, Simulations of right and left atrial pressure waves at rest (left) and during exercise (right) from the average patient with HFpEF before simulated insertion of an IASD. C, Right and left atrial pressure waves following simulated insertion of an IASD. D, Blood flow waveform across the IASD at rest and during exercise showing continuous left‐to‐right flow. LA indicates left atrium; and RA, right atrium. Reproduced in part from Kaye et al 28 with permission. Copyright ©2014, Elsevier.
