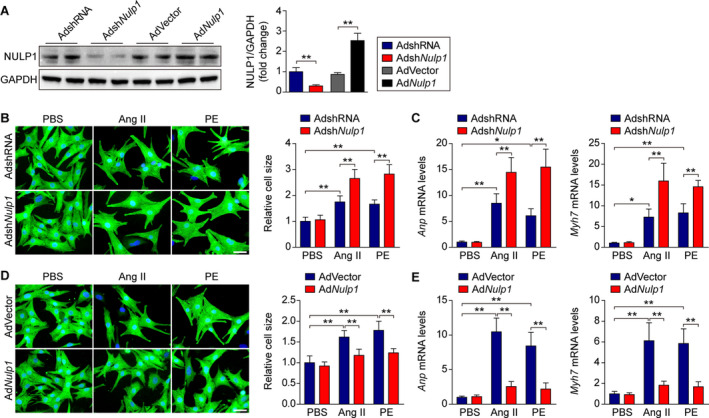
Figure 2. NULP1 (nuclear localized protein 1) protects against Angiotensin II‐ (Ang II‐) and phenylephrine‐ (PE‐)induced cardiomyocyte hypertrophy in vitro.

A, Immunoblots and quantification of NULP1 protein levels in isolated neonatal rat ventricular myocytes (NRVMs) infected with the indicated adenoviruses (AdshRNA and AdshNulp1, AdVector and AdNulp1). n=4 samples per group. B, Left, representative images of immunofluorescence staining for α‐actinin (green) and DAPI (blue) in cultured NRVMs infected with adenoviruses expressing shRNA (AdshRNA) or shNulp1 (AdshNulp1) followed by 48 hours of PBS, Ang II (1 μmol/L) or PE (100 μmol/L) treatment. Scale bar, 20 μm. Right, relative cell size of cultured NRVMs infected with AdshRNA or AdshNulp1 in response to PBS, Ang II, or PE stimuli. n>50 cells per group. C, quantitative polymerase chain reaction (qPCR) analyses of the mRNA levels of atrial natriuretic peptide (Anp) and Myh7 in PBS‐, Ang II‐, or PE‐treated NRVMs infected with AdshRNA or AdshNulp1. n=4 samples per group. D, Left, representative images of immunofluorescence staining for α‐actinin (green) and DAPI (blue) in cultured NRVMs infected with empty adenoviral vector (AdVector) or adenovirus expressing Nulp1 (AdNulp1) followed by 48 hours of PBS, Ang II (1 μmol/L), or PE (100 μmol/L) treatment. Scale bar, 20 μm. Right, relative cell size of cultured NRVMs infected with AdVector or AdNulp1 in response to PBS, Ang II, or PE stimuli. n>50 cells per group. E, qPCR analyses of the mRNA levels of Anp and Myh7 in PBS‐, Ang II‐, or PE‐treated NRVMs infected with AdVector or AdNulp1. n=4 samples per group. For all statistical plots, the data are presented as the mean±SD; in (A through E) *P<0.05, **P<0.01; the statistical analysis was performed using a 1‐way ANOVA. GAPDH indicates glyceraldehyde‐3‐phosphate dehydrogenase.
