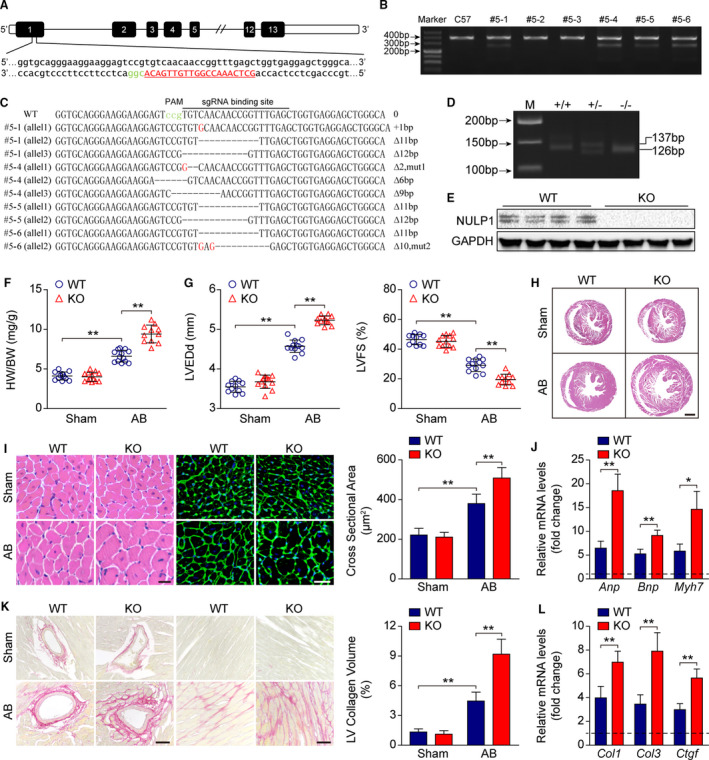
Figure 3. Nulp1 deficiency in mice exacerbates aortic banding (AB)‐induced cardiac hypertrophy.

A, Single guide RNA was designed and constructed to target exon 1 of the Nulp1 gene. B, T7 endonuclease 1 assays were used to screen live births of F0 mice. Cleavage products were identified for founders #5‐1, #5‐4, #5‐5, and #5‐6. C, The polymerase chain reaction (PCR) products of the 4 mutant founders were TA cloned and sequenced so that the precise mutations of the indels could be verified. D, Genotyping of Nulp1‐knockout (KO) mice via PCR and 3.0% agarose gel electrophoresis. A 137‐bp band indicated the wild‐type (WT) allele, and a 126‐bp band indicated the mutated Nulp1 allele. E, Nulp1 deletion was validated by western blot analysis. F, Comparison of heart weight (HW)/body weight (BW) ratios in wild‐type (WT) and KO mice subjected to sham or AB surgery for 4 weeks. n=11 to 13 mice per group. G, Echocardiography analyses showing left ventricular end‐diastolic diameter (LVEDd) and left ventricular fractional shortening (LVFS) of WT and KO mice subjected to sham or AB (aortic banding) operation for 4 weeks. n=11 to 12 mice per group. H, hematoxylin and eosin (H&E) staining of whole‐heart sections along the short axes showing the gross morphology of the hearts from WT and KO mice 4 weeks after sham or AB surgery. n=6 to 8 mice per group. Scale bar, 1000 μm. I, Left, heart sections stained with H&E and WGA (wheat germ agglutinin) showing the individual myofibril morphology in the indicated groups. n=6 to 8 mice per group. Scale bars, 20 μm. Right, quantification of the average cross‐sectional areas of cardiomyocytes from the indicated groups. n>100 cells per group. J, mRNA levels of hypertrophic marker genes atrial natriuretic peptide (Anp), brain natriuretic peptide (Bnp), and Myh7 as determined by quantitative PCR (qPCR) in the indicated groups. n=4 mice per group. K, Left, picrosirius red (PSR) staining of heart sections from WT and KO mice subjected to sham or AB operation for 4 weeks to visualize collagen deposition. n=6 to 8 mice per group. Scale bars, 50 μm. Right, quantitative results of LV collagen volume in the indicated groups. n>40 fields per group. L, qPCR analyses of the transcript levels of fibrotic marker genes collagen I (Col1), collagen III (Col3), and connective tissue growth factor (Ctgf) in the indicated groups. n=4 mice per group. For all statistical plots, the data are presented as the mean±SD; in (F, G, I through L) *P<0.05, **P<0.01; the statistical analysis was performed using1‐way ANOVA or two‐tailed student's t test. In (J and L), the dotted line indicates the mRNA levels in the WT sham group, which were normalized to 1. GAPDH indicates glyceraldehyde‐3‐phosphate dehydrogenase.
