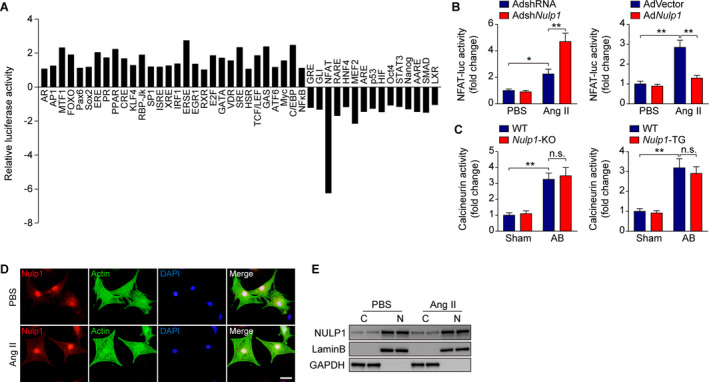
Figure 5. NULP1 (nuclear localized protein 1) regulates nuclear factor of activated T cell (NFAT) signaling during cardiac hypertrophy independent of calcineurin.

A, The results of the Cignal 45‐Pathway Reporter Array in H9C2 cells transfected with plasmids overexpressing green fluorescent protein (GFP) or NULP1. B, NFAT‐luciferase activity in neonatal rat ventricular myocytes (NRVMs) infected with adenoviruses AdshRNA and AdshNulp1 (left) or AdVector and AdNulp1 (right) in response to PBS), Ang II (angiotensin II, 1 μmol/L) stimulation. n=3 per group. C, Calcineurin phosphatase activity in the lysates of the left ventricle from the indicated experimental groups. n=6 mice per group. D, Representative images of immunofluorescence staining for NULP1 (red) and α‐actinin (green) in NRVMs followed by 6 hours of PBS or Ang II (1 μmol/L) treatment. DAPI stain (blue) marked the position of nuclei. E, Representative western blots showing the NULP1 protein levels in the cytoplasm (C) and nucleus (N) of NRVMs in response to PBS or Ang II (1 μmol/L) stimuli for 6 hours. For all statistical plots, the data are presented as the mean±SD; in (B and C) *P<0.05, **P<0.01 and n.s. indicates no significance; the statistical analysis was performed using a 1‐way ANOVA. AB indicates aortic banding; GAPDH, glyceraldehyde‐3‐phosphate dehydrogenase; KO, knockout; and WT, wild type.
