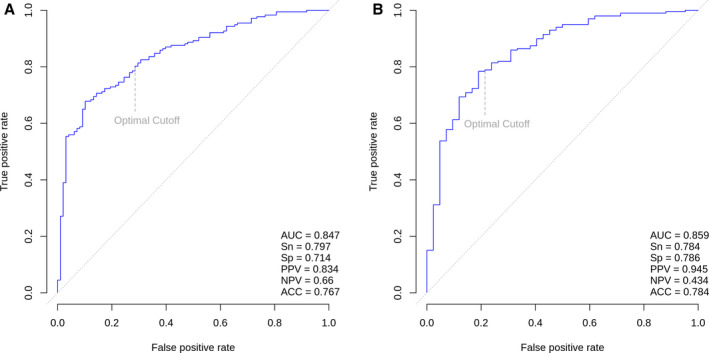
Figure 1. Receiver operating characteristic curve for (A) the internal validation cohort (n=275) and (B) the external validation cohort (n=241).

ACC indicates predictive accuracy; AUC, area under the receiver operating characteristic curve; NPV, negative predictive value; PPV, positive predictive value; Sn, sensitivity; and Sp, specificity.
