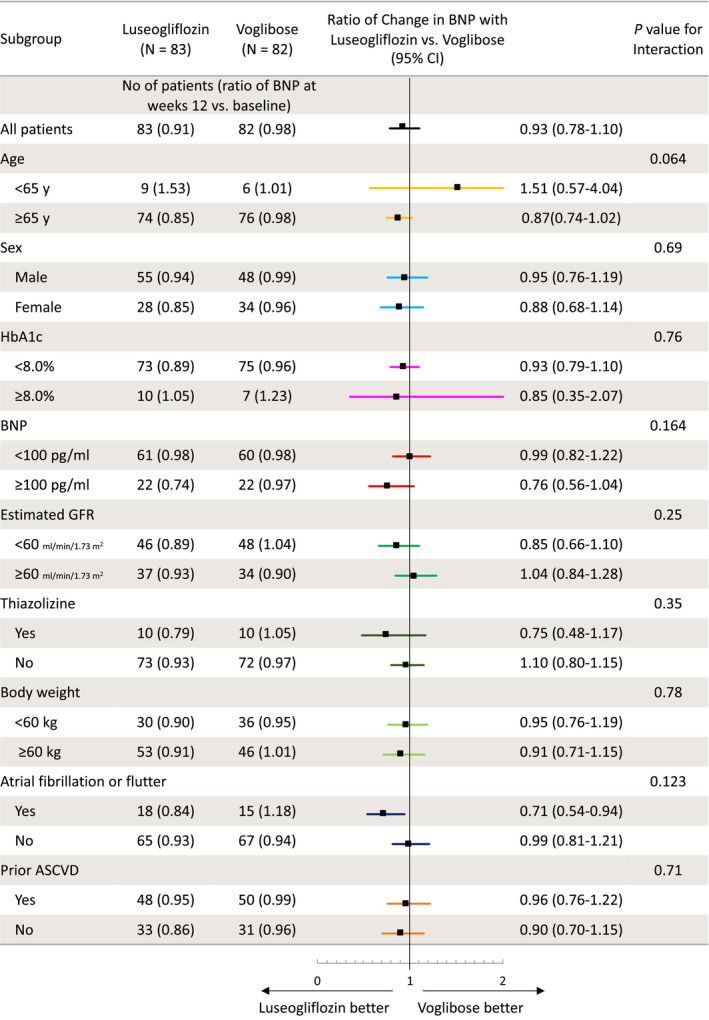
Figure 3. Subgroup analyses of the change in BNP concentrations.

Data on the change in ratio of BNP concentrations from baseline to 12 weeks with each treatment according to subgroup are shown. ASCVD indicates atherosclerotic cardiovascular disease; BNP, B‐type natriuretic peptide; GFR, glomerular filtration rate; and HbA1c, hemoglobin A1c.
