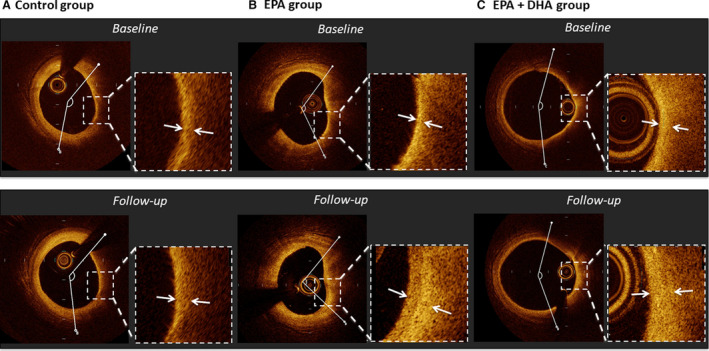
Figure 2. Representative cases of optical coherence tomography analysis.

A, In a case from the control group, fibrous cap thickness slightly increased (130–150 μm) and lipid arc changed very slightly (134.9–145.0°) over 8 months. B, In a case from the EPA group, fibrous cap thickness increased (60–210 μm) and lipid arc decreased (118.3 to 95.1°) over 8 months. C, In a case from the EPA+DHA group, fibrous cap thickness increased (60–150 μm) and lipid arc decreased slightly (158.7 to 145.3°) over 8 months. DHA indicates docosahexaenoic acid; and EPA, eicosapentaenoic acid.
