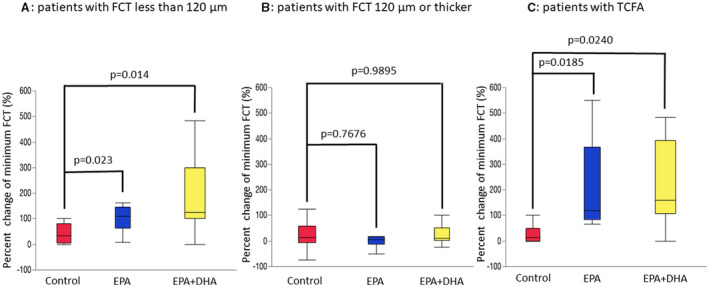
Figure 4. Comparison of the percent change for minimum FCT at the 8‐month follow‐up relative to baseline in the control, EPA, and EPA+DHA groups in subgroup analysis.

A, In patients with minimum FCT <120 µm, percent change for FCT was significantly lower in the control group (33.3; interquartile interval, 5.0–80.0) compared with the EPA group (110; interquartile interval, 64.3–145.6; P=0.0230 vs control) or the EPA+DHA group (125; interquartile interval, 100.0–300.0; P=0.0140 vs control). B, In patients with minimum FCT ≥120 µm, there were no significant differences between the control group (14.2; interquartile interval, −6.0 to 57.5) and the EPA group (5.6; interquartile interval, −13.0 to 15.5; P=0.768 vs control) or the EPA+DHA group (10.9; interquartile interval, 1.8–10.9, P=0.990 vs control). C, In patients with TCFA, percent change for minimum FCT was significantly higher in the EPA group (120.0; interquartile interval, 83.3–366.7; P=0.0185 vs control) or the EPA+DHA group (160; interquartile interval, 108.3–391.7; P=0.0240 vs control) compared with the control group (15.0; interquartile interval, 0–50.0). DHA indicates docosahexaenoic acid; EPA; eicosapentaenoic acid; FCT, fibrous cap thickenss; interquartile interval, interquartile range; and TCFA, thin‐cap fibroatheroma.
