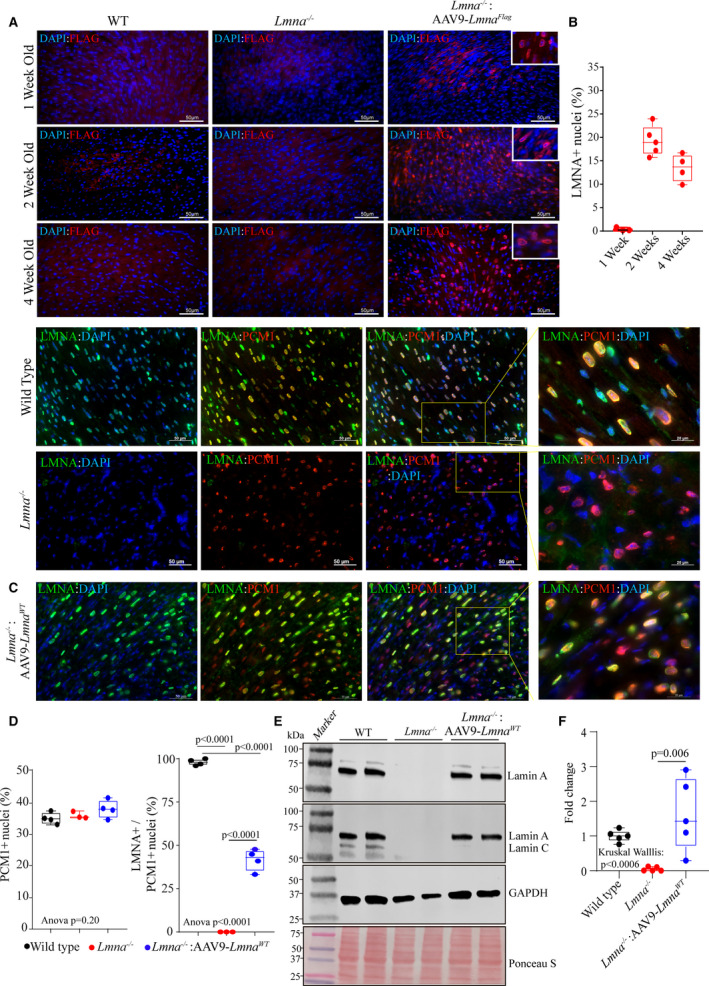
Figure 1. Expression and localization of LMNA in the heart of Lmna−/− mice upon AAV9‐mediated LMNA re‐expression.

A, Immunofluorescence staining of thin myocardial sections showing FLAG‐LMNA (in red) expression in 1, 2, and 4‐weeks old wild type, Lmna−/− and Lmna−/−:AAV9–LmnaFlag mice. Nuclei were counterstained with DAPI (blue). B, Respective quantitation of LMNA+ nuclei as a fraction of total DAPI+ nuclei per heart (n=3–5). C, IF staining of myocardial sections in 2 weeks old wild type, Lmna−/− and Lmna−/−: AAV9‐Lmna WT LMNA (in green) and anti‐PCM1 antibody (in red). Higher magnification of the overlay of LMNA and PCM1 with DAPI. D, Respective quantitative data showing the percentage of PCM1 positive nuclei (marking cardiac myocytes) in the WT (n=4), Lmna−/− (n=3) and Lmna−/−:AAV9‐Lmna WT (n=4) and percentage of cardiac myocytes expressing LMNA (PCM1+/LMNA+nuclei). E, Immunoblot (IB) showing the expression of LMNA in whole heart lysates of 2‐week old mice in WT, Lmna−/− and Lmna−/−:AAV9‐Lmna WT mice using an anti‐LMNA antibody. Protein molecular weight markers are shown to the left, and GAPDH is used as a loading control together with total protein staining using Ponceau S. F, Quantitative data for LMNA protein expression fold change normalized to GAPDH and relative to WT mice. Data were obtained from N=5 mice heart/genotype and shows variability in the LMNA protein expression in the AAV9‐LMNA treated samples. Normality of data distribution was assessed by Shapiro–Wilks test. P values for Kruskal–Wallis test and Dunn’s multiple comparison are shown. Only P values that were significant (P<0.05) are shown. AAV9 indicates adeno‐associated virus serotype 9; DAPI, 4′,6‐diamidino‐2‐phenylindole; LMNA, lamin A; PCM1, pericentriolar material‐1; and WT, wild‐type.
