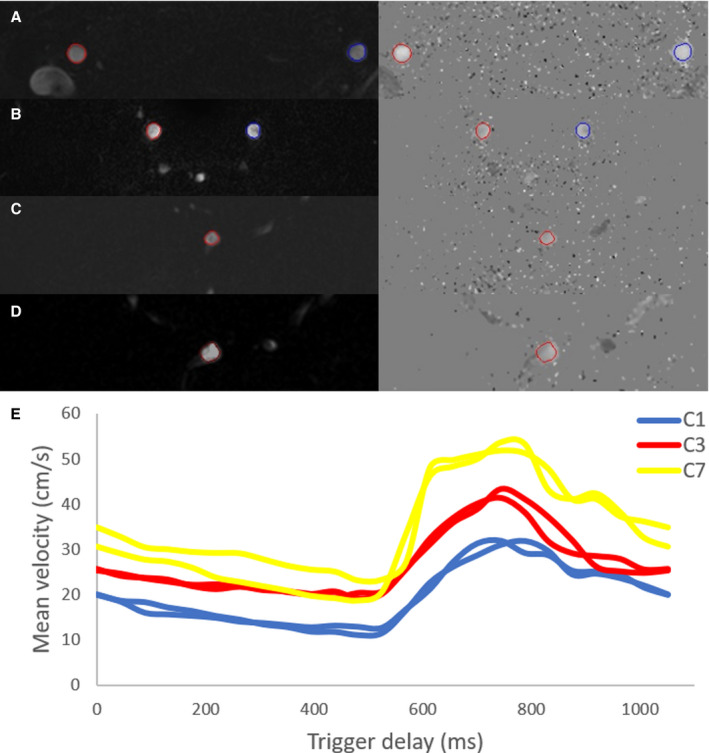
Figure 2. Magnitude and phase contrast images shown for 3 different segments for the first heart phase within 1 representative subject.

For every segment the contour (region of interest) was automatically drawn and propagated. All regions of interest were included for this representative subject. A, segment C1. B, segment C3. C, segment C7 right. D, segment C7 left. E, All mean velocity curves (in cm/s) of this subject are combined and shown over trigger delay (in milliseconds) for the 3 segments, C1 (blue), C3 (red) and C7 (yellow) of the internal carotid artery.
