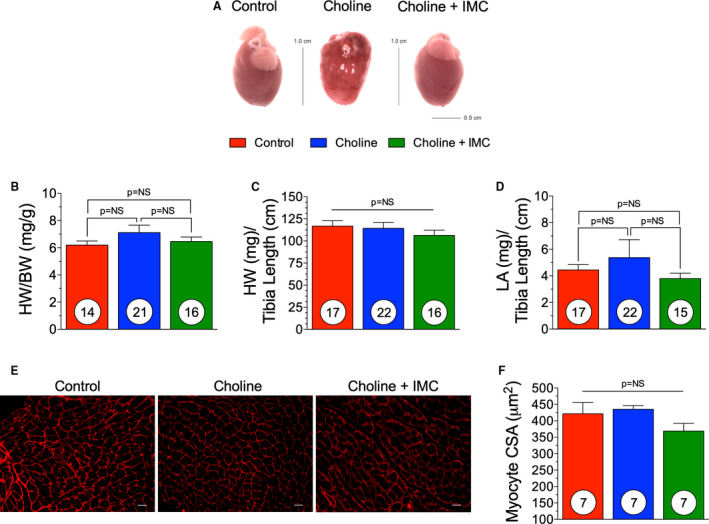
Figure 7. Hypertrophic Remodeling following IMC Administration.(A), Representative images of hearts taken at 15 weeks.

(B), Heart weight (HW) to body weight (BW) of control, trimethylamine N‐oxide (TMAO) and TMAO withdrawal groups. (C), Heart weight to tibia length of control, TMAO, and TMAO withdrawal groups. (D), left atrial (LA) weight to tibia length. (E), Representative photomicrographs (×40) of wheat germ agglutinin staining for myocyte cross sectional area (CSA) (scale bar=20 μm) and (F) quantification in all three groups. Results are shown as mean± SEM. P=NS (not significant).
