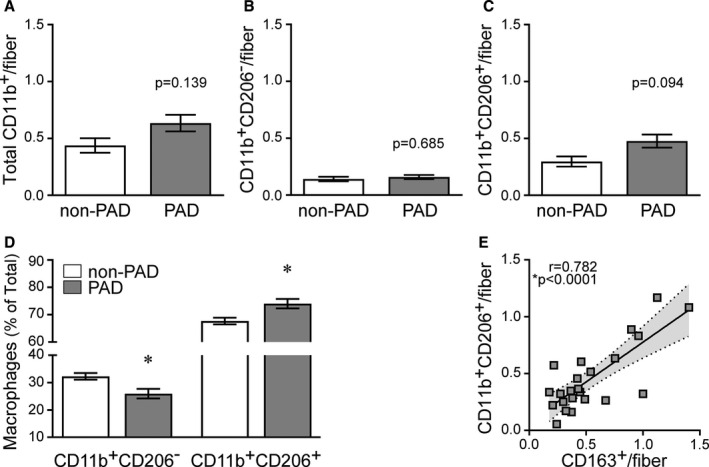
Figure 2. Quantification of macrophage content in gastrocnemius muscle cross‐sections. A through D, Non‐peripheral artery disease (non‐PAD, n=6), peripheral artery disease (PAD) (n=25).

Data are expressed as mean±SE; P values adjusted for race, *significance P≤0.05. A, Total cluster of differentiation (CD) 11b+ macrophages in patients with PAD compared with patients without PAD. B, CD11b+CD206− macrophages in patients without PAD and patients with PAD. C, CD11b+CD206+ macrophages in patients without PAD and patients with PAD. D, Relative abundance (% of total) of CD206− and CD206+ macrophages in patients with PAD and patients without PAD. E, Association of the M2c macrophage marker CD163 with the number of CD206+ macrophages, supporting CD206+ macrophages as M2‐like. Non‐PAD (n=5), PAD (n=18). Association determined by Pearson product moment correlation, r=partial correlation coefficient.
