
Figure 1. Flowchart.
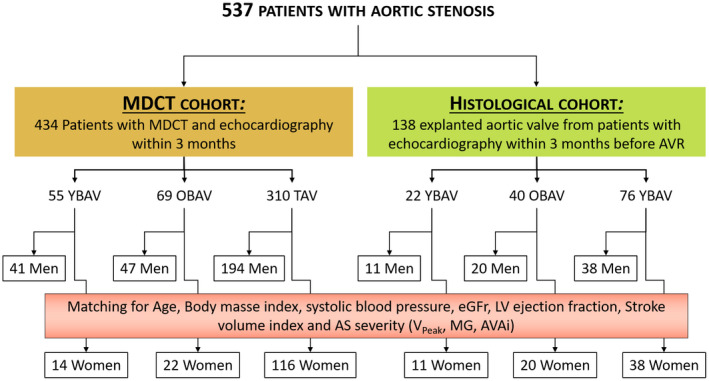
The flow chart of the study describes the multidetector computed tomography cohort and the histological cohort as well as the match between men and women in each age‐valve phenotype group. AVAi indicates indexed aortic valve area; AVR, aortic valve replacement; eGFR, estimated glomerular filtration rate; LV, left ventricular; MDCT, multidetector computed tomography; MG, mean transvalvular gradient; and Vpeak, peak aortic jet velocity.