
Figure 2. Masson's trichrome and Picrosirius red staining of aortic valves according to the sex‐age‐phenotype group.
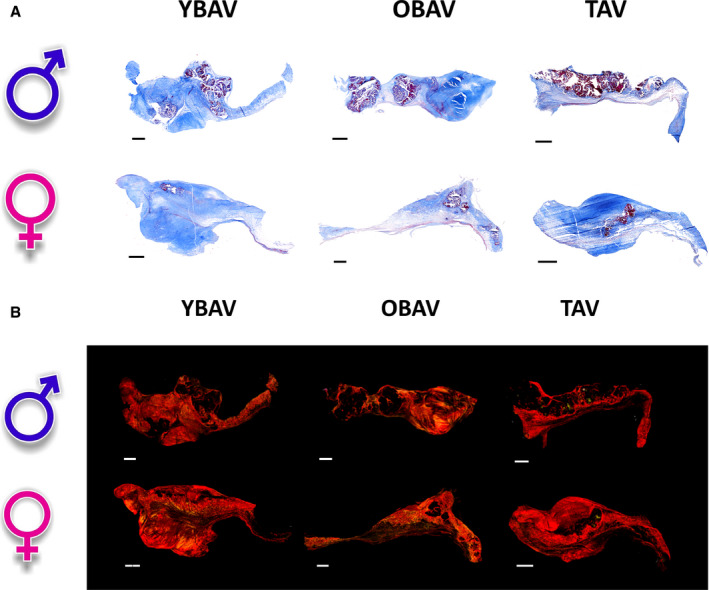
A, Valve histology at 20× original magnification with Masson's trichrome staining. Dark blue sections represent collagen fibers (dense connective tissue); light blue sections represent extracellular matrix fibers (loose connective tissue); red and purple nodules represent calcium nodules; and red fibers represent myofibroblast‐like cells. B, Valve histology at 20× under polarized light with Picrosirius red staining. Red‐orange‐green fibers represent collagen fibers. ♂ indicates men; ♀, women; OBAV, older patients with a bicuspid aortic valve; YBAV, younger patients with a bicuspid aortic valve; and TAV, tricuspid aortic valve. Scale bar=1 mm.