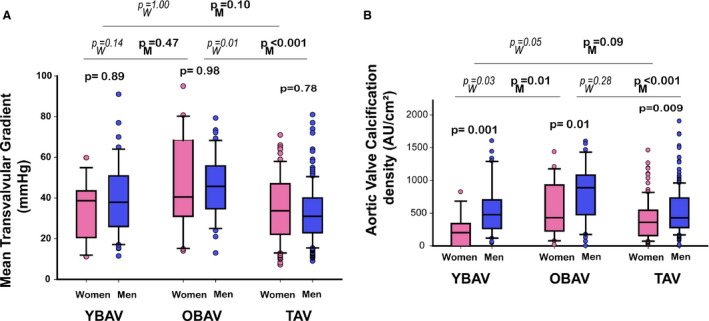
Figure 3. Aortic valve gradient assessed by echocardiography and calcification assessed by MDCT according to the sex‐age‐phenotype group.

Box plot graphs showing (A) mean transvalvular gradient and (B) aortic calcification density (ie, aortic valve calcification divided by cross‐sectional aortic annulus). In each age‐phenotype group, women and men had equivalent hemodynamic severity aortic stenosis; however, women had lower calcification than men. In men, OBAV patients show higher aortic valve calcification than TAV patients linked to slightly more severe aortic stenosis, and YBAV despite equivalent aortic stenosis severity. In women, YBAV shows the lowest aortic valve calcification density despite similar aortic stenosis severity. Box plot format: the box indicates the 25th to 75th percentiles; the line within the box indicates the median; and the whiskers indicate the 10th to 90th percentiles. OBAV indicates old bicuspid aortic valve; PM, P‐value between men groups; PW, P‐value between women groups; TAV, tricuspid aortic valve; and YBAV, young bicuspid aortic valve.
